Imagine that you have trained a machine learning model based on last year’s winter weather data so that it can predict weather trends for you. During testing, the model performed impressively, correctly predicting snowfall and temperature drops. But when summer arrives, the model still predicts snowstorms in July. This is not a bug, but a classic example of data drift. Here, the model fails because the data from the outside world has changed according to the environment, but the model was not trained to adapt to the change. This is exactly where MLOps and AI model monitoring come in. They help keep models accurate and reliable even after deployment.
When you skip proper monitoring, models start to lose accuracy without any warning. Predictions slowly become unreliable. The damage appears in real-world outcomes. It ranges from bad product suggestions in e-commerce to dangerous mistakes in healthcare diagnostics. Research shows that nearly 90% of machine learning models never reach production, and many that do break down within months due to unnoticed data drift or operational issues.
At Learning Breeze, we believe science should be simple and useful. Our goal is to simplify complex topics like model deployment and monitoring. We aim to create practical tools that anyone can understand and apply. In this guide, you’ll learn how to monitor ML models effectively. You’ll also learn how to design a strong MLOps workflow. Finally, you’ll track AI performance to keep your systems healthy and impactful. Let’s begin our journey!
What is MLOps?
MLOps stands for Machine Learning Operations, but just knowing the full form doesn’t really explain what it does. Let’s look at it in a better way.
Consider MLOps as a scientific laboratory that never shuts down. In a normal lab, you design an experiment, test a hypothesis, check the results, and once everything is confirmed, you publish it and move on.
MLOps takes this exact process but keeps it running continuously instead of stopping after one result.
The Science Analogy: Experimentation to Recalibration
In science, an experiment isn’t considered finished until the results are tested again, shared with others, and studied in practice use. The MLOps lifecycle follows the same idea, work doesn’t end at building a model; it continues until that model proves itself in action.
- Experimentation ($R\&D$ Phase): Training and validating the model.
- Validation (Peer Review): Rigorous testing to ensure quality and reproducibility.
- Deployment (Publication): Making the validated model available for use.
- Observation (Long-term Study): AI model performance tracking and monitoring in the real world.
- Recalibration (Scientific Iteration): Retraining the model based on new, observed data to improve its performance.
This repeating and evolving process forms the core of the ML lifecycle. With strong MLOps practices, teams can easily reproduce their work. That means the same model you deploy today can be rebuilt and verified in the exact same way, even six months later.
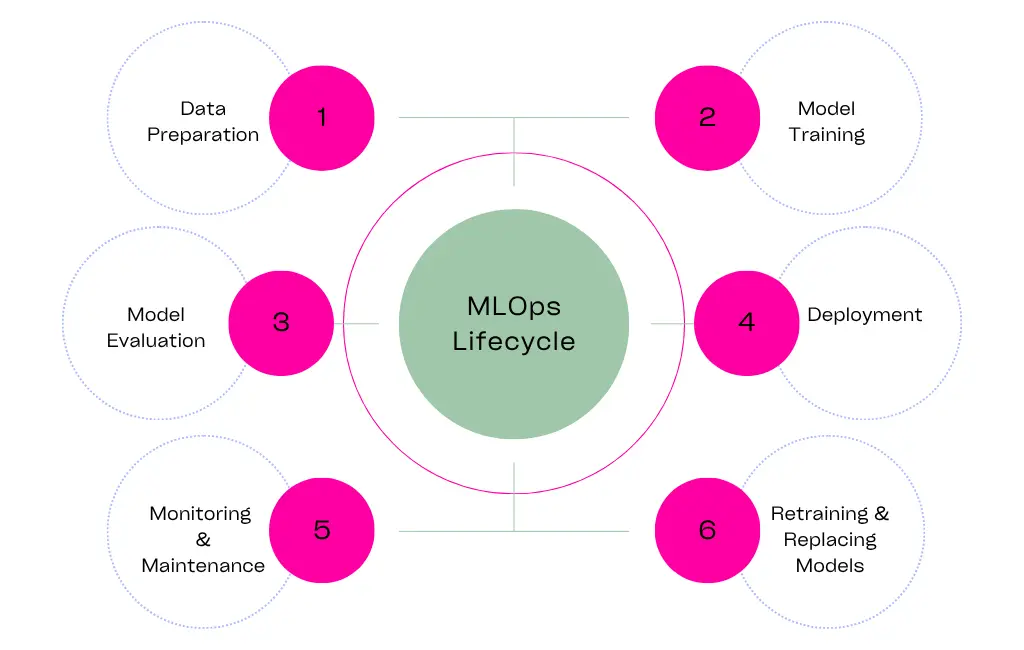
The Full MLOps Pipeline: Step-by-Step Overview
A machine learning system works well only when it follows a clear and structured MLOps pipeline. This pipeline runs as a continuous process rather than a one-time setup. Many people consider this flow as the CI/CD pipeline (Continuous Integration and Continuous Delivery). However, in the case of ML systems, it fits better to call it a CI/CT pipeline, which stands for Continuous Integration and Continuous Training.
To properly explore MLOps, we break its pipeline into simple and manageable stages. Each stage plays a clear technical role, and when they work together, they build a strong and efficient system for deploying AI models.
1. Experimentation and Model Training
In this first stage, data scientists clean the data, create meaningful features, choose the right algorithm, and adjust hyperparameters. During this process, they build and improve all the key components, the data files, the code, and the trained model that will later go into deployment. It’s important to keep version control for both the code and the data to avoid confusion and ensure clarity. Tools like MLflow help track experiments and make this entire phase easy to repeat and manage.
2. Packaging and Containerization
Before deployment, you need to package the model and all its required files in a secure and portable way. The best way to do this is through containerization, usually with Docker.
A Docker image works like a self-contained box. It makes sure the environment used during model training is the same as the one used in production. This removes the classic “it works on my machine” issue. Inside the container, you include everything the model needs, like the model file itself, the logic to score predictions, and important libraries such as Scikit-learn or TensorFlow.
3. Deployment
Deployment means making the model available to real users through an inference pipeline. In most cases, we deploy models as microservices using tools like FastAPI or Flask. There are many different ways to deploy a model depending on the use case:
- Real-time API Endpoints: Used when instant predictions are needed, like checking someone’s credit score within seconds.
- Batch Prediction Jobs: Used for scheduled and large-scale predictions, such as generating daily sales forecasts in one go.
- Edge Deployment: Used when predictions need to happen directly on a device with very low delay, like a camera detecting objects on the spot.
In this stage, the model becomes part of the organization’s bigger AI workflow and starts serving practical tasks.
4. Continuous Monitoring and Feedback Loops
The center point of our discussion is one goal: making sure that the model works the way it should. The monitoring system constantly checks its performance and sends feedback back into the pipeline. If it spots a big drop in performance, it immediately sends an alert and pushes the system into the final stage. This process keeps everything aligned with AI governance policies by actively maintaining both performance and fairness.
5. Retraining and Continuous Improvement
When the monitoring system detects that the model’s performance has dropped below the set threshold, it signals the need for action. At this point, the system can automatically retrain the model using new production data. Alternatively, it can alert a human expert to investigate the cause of the drift. This step completes the cycle. It turns the model into a truly “living” system. The model continues learning and adapting over time.
What Is AI Model Monitoring? A Clear Look at How It Works
Model deployment and monitoring are two sides of the same coin. Model deployment gets the model into action, while monitoring makes sure it keeps performing the right way. One launches the model into real use, and the other constantly checks that it’s working as expected. Let’s break it down clearly so you know what to look for and why it actually matters.
Model monitoring means keeping a close eye on an ML model once it’s deployed in production. The goal is to track its performance, health, and real-time metrics to make sure it keeps giving accurate and trustworthy results. This step is crucial because, unlike normal software, machine learning models can lose accuracy slowly and silently over time. This practice is widely known as model observability.
What Exactly Do We Monitor?
The main challenge lies in spotting the different ways a model can start to decline. To do that effectively, we track a set of monitoring metrics, which are grouped into three main categories:
1. Performance Metrics
This shows how accurate the model’s predictions are. In classification tasks, we usually look at precision, recall, or F1-score. In regression tasks, we often use Mean Squared Error (MSE). The real challenge appears when the correct answer isn’t available right away. For example, if a model predicts whether a loan will default, you can only confirm its accuracy after months when the customer actually defaults or pays on time. This delay in getting the true outcome makes real-time model monitoring much more complex.
2. Operational Metrics
These are engineering metrics that track the health of the serving infrastructure, regardless of the model’s internal accuracy:
- Latency: The time taken to receive a request and return a prediction. High latency can ruin user experience.
- Throughput: The number of requests the system can handle per second.
- Error Rate: The frequency of system errors or invalid requests.
3. Data and Concept Metrics
This is the scientific core of model observability. Models fail when the data they see in production differs significantly from the data they were trained on. This difference is known as drift.
- Data Drift (or Feature Drift): This occurs when the properties of the input data change over time. For example, if a model was trained on user data where the average age was 35, there is a change. The deployed model is suddenly receiving inputs where the average age is 50. The input distribution has shifted. This requires feature drift monitoring on individual input variables.
- Concept Drift: This is far more subtle and dangerous. It occurs when the relationship between the input features and the target variable changes. The input data distribution might stay the same, but the meaning of the data has changed. For example, a spam detection model that accurately filters old types of spam may fail when a new, sophisticated type of phishing (the “concept” of spam) emerges. The inputs (words) are similar, but the relationship to the output (spam/not spam) has changed.
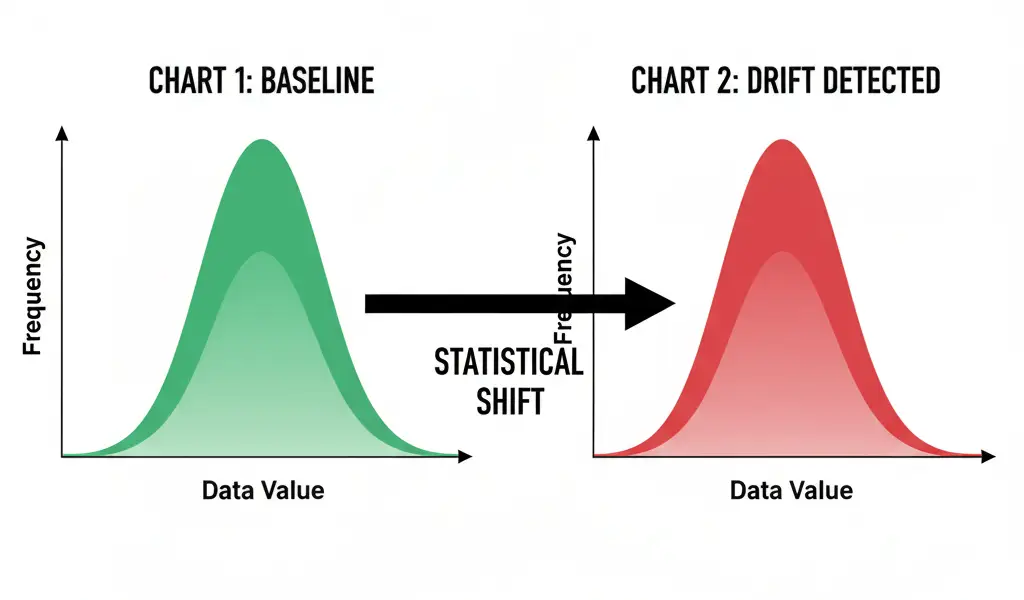
Drift Detection: A Visual Interpretation
To detect drift, we compare the current production data distribution to the baseline training data distribution. Statistical tests like the Kullback-Leibler divergence or Jensen-Shannon distance are often used to quantify the difference between two distributions.
Minimal Practical Lab: Deploy & Monitor a Simple ML Model
To make this idea clear, we’ll go step by step through a simple, practical lab-style setup. This approach gives Learning Breeze a unique edge by turning science into something you can easily visualize and connect with.
Step 1: Train a Simple Model
A data scientist uses Scikit-Learn to train a simple binary classification model, like predicting whether a house falls into a high or low price range. After training, they save the model file (for example, a .pkl file) along with the data distribution used during training. These saved elements act as the performance baseline.
Step 2: Serve with FastAPI + Docker
The trained model is wrapped in a Python API using FastAPI to handle inference requests. This service is then containerized with Docker. The deployment step is conceptually simple: pushing the Docker image to a container registry and running it on a cloud server.
Minimal Commands Only Concept: Show the conceptual simplicity:
docker build -t house-predictor . and docker run -d -p 8000:8000 house-predictor.
Step 3: Generate Test Requests and Log Predictions
Once the model starts running, it begins handling user requests. It actively captures every input feature set and the prediction it generates. All these details are immediately stored in a database. These stored records act as the foundation for effective model monitoring.
Step 4: Run Drift Detection with Evidently or MLFlow
A separate job or service periodically reads the production logs. This service uses a dedicated ML monitoring tool. It might use Evidently or the model tracking features of MLFlow. The tool compares the new data’s distribution to the original baseline distribution.
- Example Drift Detection: The job detects that the feature
Square Footagein production has a statistically significant lower mean than it did in the training data, indicating feature drift. - Alert: A notification is sent to the MLOps engineer: “Data drift detected on feature
Square Footage(p-value < 0.05).”
Handover Flow, Like a Real Monitoring Pipeline
This creates a clean and practical workflow. First, the data scientist trains the model. Then, the MLOps engineer packages and deploys it. After deployment, an automated monitoring system keeps an eye on the inference pipeline. If anything unusual happens, it triggers an alert. The data scientist then steps back in to review the model or retrain it if needed. This repeatable loop forms the real-world MLOps pipeline used in production today.
Small Team vs Enterprise MLOps Stack Comparison: Which Setup Fits You Best?
Choosing the right ML monitoring tools and architecture is less about selecting the “best” tool and more about aligning the choice with your team’s size, budget, and skill set.
| Factor | Small Team / Startup | Enterprise / Large Team |
|---|---|---|
| Focus | Speed, open-source, ease of use | Scale, security, AI governance, cost efficiency |
| Tools | MLFlow (Tracking), Evidently (Drift), Docker, FastAPI | TFX, Amazon SageMaker, Azure ML, Kubeflow, Arize |
| Infrastructure | Simple VMs or Serverless Functions (e.g., AWS Lambda) | Kubernetes (K8s) for autoscaling and resilience |
| Monitoring | Simple email/Slack alerts on drift threshold | Dedicated dashboards, complex alerting, integrated feedback loops |
| Complexity | Build only what is needed | Buy or integrate commercial MLOps platforms |
AI Model Monitoring Case Studies: Real Examples of Success and Failure
When you truly see how monitoring affects AI models, its importance becomes obvious. These real-world cases show exactly why MLOps monitoring isn’t just useful, it’s essential.
1. Healthcare Triage Misprediction Scenario
A hospital rolled out an AI model to manage emergency room triage, ranking patients based on their vital signs. At first, it worked smoothly and made accurate decisions. But when a global pandemic hit, the type of patients coming in changed drastically. A new demographic started arriving with similar symptoms, and the overall data pattern shifted.
The model began making wrong priority decisions because of this concept drift. The relationship between the input data and the expected output no longer matched what it had learned during training. Since there wasn’t strong real-time monitoring, these mistakes went unnoticed and led to poor outcomes.
If the system had an external drift detection setup, it could have spotted the sudden change in data patterns early. That alert could have forced a pause and triggered immediate retraining before the model caused harm.
2. E-commerce Recommendation Drift
An e-commerce giant used a recommendation engine that relied on past purchase history to suggest new products. After a major holiday sale, a huge wave of first-time customers entered the platform. These new users had little to no purchase history. As a result, the model began pushing generic and low-value recommendations to nearly everyone. The incoming data lacked depth compared to the pre-holiday user profiles, which caused a clear data drift. As a result, the platform saw a 15% drop in recommendation-based revenue. If the team had monitored input feature patterns, they might have caught this drift early. They could have identified changes such as the drop in “number of past purchases.” With timely monitoring, they could have switched to a cold start model for new users and prevented the financial hit.
3. Spam Detection with Concept Drift After New Trends
A company used an ML-powered email filter to catch phishing attempts. But attackers kept changing their tactics, like sending image-based spam or crafting emails in very specific local languages. As a result, the model’s accuracy started to drop because its understanding of “spam” couldn’t keep up with these new tricks. This is a clear case of concept drift.
To fix it, the team began actively monitoring the model’s accuracy. They used a small batch of newly received emails that were quickly labeled. Whenever a fresh wave of attacks caused performance to fall below the safe limit, the system automatically triggered a retraining cycle. This process kept the model sharp and updated.
Ethical AI Monitoring: Ensuring Fair, Safe, and Responsible Model Performance
AI governance and ethics are not abstract concepts; they are engineering requirements built into the monitoring pipeline.
Monitoring must extend beyond predictive accuracy to include social and ethical metrics, especially for regulated industries.
- Monitoring Biases and Fairness Shifts: If a model’s prediction accuracy drops more for one demographic group (e.g., women in a loan application model) than another, that is a fairness alert. We monitor metrics like Equal Opportunity Difference across different protected groups.
- Compliance Alerts: Models used in regulated sectors (finance, healthcare) must justify their decisions. Monitoring can track if the model starts relying heavily on prohibited features. It triggers a compliance alert in plain language. This happens before a regulator needs to intervene.
Tool Comparison Guide: Best Minimal Configuration Options
“There are many ML monitoring tools available, and choosing the right one comes down to whether you want to build your own solution or use an existing platform.
| Tool | Type | Strength | Quick Practical Use |
|---|---|---|---|
| MLflow | Open Source Platform | ML lifecycle management, experiment tracking. | Track models and log parameters during training. |
| Evidently AI | Open Source Library | Drift detection and model quality reports. | Generate daily HTML reports comparing production vs. training data. |
| TFX (TensorFlow Extended) | Google Open Source | Production-ready pipeline orchestration for TensorFlow models. | Build a structured, scalable CI/CT pipeline. |
| SageMaker Monitor | AWS Managed Service | Integrated model observability and automatic data quality checks. | Set up a baseline and automated schedule within AWS console. |
| Arize | Commercial Platform | Full-stack observability, root cause analysis for model errors. | Deep drill-down into why a prediction was wrong (Explainability). |
Conclusion
Moving an AI model from a successful notebook experiment to a long-lasting, reliable service is not as simple as it sounds. It requires a disciplined approach with an engineering mindset. The model is treated like a living system. It naturally changes and degrades over time.
MLOps and AI Model Monitoring are more than just trendy terms. They reflect a true commitment to scientific thinking. In real science, the work doesn’t stop at deployment, it actually begins when you start observing how the model behaves in the real world. By setting up continuous monitoring and feedback loops, you ensure your AI system stays accurate. It remains fair and useful long after launch. When you embrace ongoing iteration, your models don’t just survive, they evolve and perform even better.
Want to test your knowledge, check out our Machine Learning Quiz!
Recommended Resources for Curious Minds
To explore the practical side of MLOps and understand how it works in real operations, you can check out the expert resources listed below.
- Designing Machine Learning Systems by Chip Huyen
- The MLOps Lifecycle Toolkit by Dayne Sorvisto
- Building Machine Learning Powered Applications by Emmanuel Ameisen
- Hands-On Machine Learning with Scikit-Learn, Keras, and TensorFlow by Aurélien Géron
Frequently Asked Questions About Model Monitoring
You do not need labeled data for all monitoring. Data drift and operational metrics (latency) can be monitored without labels. However, monitoring model accuracy decay requires labeled data, often through a delayed feedback loop or a small, manually labeled validation stream.
There is no fixed schedule. Retraining should be event-driven, tied directly to a significant change. A drop in model accuracy or the detection of major concept drift should trigger a retraining event. For a model with stable data, retraining might happen quarterly; for volatile data (e.g., financial trading), it could be daily.
Yes, you can. You can manually check logs and run statistical checks on production data. However, for any model in a system larger than a proof-of-concept, manual monitoring is too slow and error-prone. Automation via an MLOps pipeline is essential for scale and reliability.
Concept drift is caused by fundamental changes in the underlying system the model is predicting. This could be due to new user behavior, changes in laws or regulations, external competition, or adversaries adapting their tactics (e.g., in fraud or spam).
References and Further Reading
- Shleifer, D., & Shlomi, I. (2020). Introducing MLOps: How to Industrialize Machine Learning. O’Reilly Media. This resource details the integration of DevOps practices with machine Learning pipelines.
- Gartner: Top Trends in Data and Analytics. Provides context on the industry shift towards Model Observability and robust AI governance.
- Sculley, D. et al. (2015). Hidden Technical Debt in Machine Learning Systems. Advances in Neural Information Processing Systems (NIPS). Essential reading on the non-ML components (data management, infrastructure) that dominate real-world system costs.
- Evidently AI Documentation: Provides practical, open-source methodology for understanding and implementing data drift and model quality checks in production.
- The TensorFlow Extended (TFX) Team: Data Validation and TFX Pipelines. Offers canonical methods for setting up baselines and detecting anomalies like feature drift within an automated CI/CT pipeline.
- Webber, M. (2020). Practical MLOps: How to take models to production. O’Reilly Media. Covers practical implementation of monitoring tools like Prometheus and Grafana for real-time model tracking.
- US National Institute of Standards and Technology (NIST): AI Risk Management Framework (AI RMF). Outlines principles for managing risks, which directly informs the need for monitoring biases and compliance shifts as part of AI governance.