
The human heart anatomy shows that this organ is far more than just a symbol of love or feelings, it keeps us alive every second. It beats over 100,000 times each day and pushes nearly 7,500 liters of blood through arteries, veins, and tiny capillaries. With this nonstop flow, the heart delivers oxygen and nutrients to every cell. It also clears away the harmful waste. This makes life possible.
The heart does much more than just pumping blood. It’s a remarkable piece of natural engineering with four chambers, four valves, special electrical wiring, and its own blood supply. Every single beat happens through a perfect rhythm of muscle squeezes, valve openings, and electrical signals.
In this article, we’ll explore the human heart anatomy and its function. We’ll delve into its detailed structure and how it keeps blood moving. We will also examine what goes wrong when it fails. Additionally, we will discover how modern science is finding new ways to repair or even replace it.
If you’ve ever wanted to know what the heart looks like, this guide is for you. It explains how the heart actually works. It also describes why it sometimes breaks down. You’ll learn what you can do to keep it strong. So, let’s get started.
Quick Anatomy Refresh
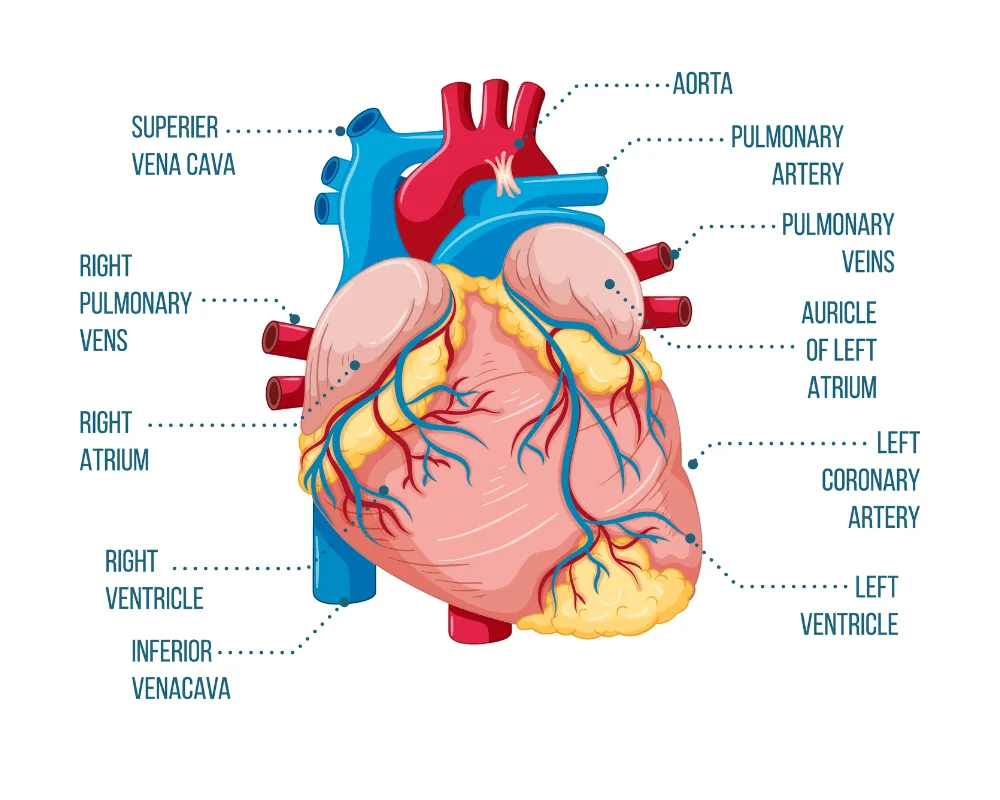
Our heart works as a strong, muscular pump. It has four chambers: two atria on the top and two ventricles at the bottom. Four valves act like one-way doors, guiding the blood so it always moves in the right direction. The main blood highways—the superior and inferior vena cava, the pulmonary arteries and veins, and the aorta—carry blood into and out of the heart.
The heart muscle also needs its own blood supply to stay alive and keep working. So, the coronary arteries, which run across the heart’s surface, provide this vital blood flow. As you can see in the diagram below, a healthy heart functions as a well-coordinated team of chambers, valves, and vessels. All components work in perfect sync.
Now, let’s take a detailed look at these important components.
1. Four Chambers and Their Roles
- Right Atrium (RA): It collects venous blood coming from the superior and inferior vena cavae. It functions as a low-pressure reservoir. Normal pressures range between 0–8 mmHg. It sends blood into the right ventricle during diastole.
- Right Ventricle (RV): Pushes blood through the pulmonary valve into the pulmonary arteries. Its walls are thinner than those of the left ventricle. However, it still creates systolic pressures of 15–30 mmHg. This pressure is just enough for the low-resistance pulmonary circulation.
- Left Atrium (LA): It receives oxygen-rich blood from the four pulmonary veins. It generates enough pressure, usually 6–12 mmHg, to move this blood into the thick-walled left ventricle.
- Left Ventricle (LV): It acts as the heart’s main pumping chamber. Its strong muscular walls produce systolic pressures of 90–140 mmHg. This force is enough to send blood throughout the entire body.
2. Valves: One-Way Traffic Controllers
The heart uses four valves to keep blood flowing in one direction. The tricuspid valve, with its three flaps, controls the flow from the right atrium into the right ventricle. On the left side, the mitral valve, which has two flaps, guides blood from the atrium to the ventricle. The pulmonary and aortic valves are known as the semilunar valves. They step in during diastole. These valves stop blood from flowing backward into the great vessels.
Great Vessels and Coronary Circulation
The aorta starts directly from the left ventricle and continues as the ascending aorta, the arch, and then the descending aorta. The pulmonary artery takes deoxygenated blood straight to the lungs for oxygen. From the base of the aorta, the coronary arteries branch out to feed the heart muscle itself. These include three main vessels: the left anterior descending (LAD), the right coronary artery (RCA), and the left circumflex (LCx).
Hemodynamics Explained: Key Numbers You Need to Know
Doctors often explain your heart’s health using numbers. These numbers, called hemodynamics, show how well your heart pumps blood. Each one tells a part of your heart’s story. Let’s break them down and see what they really mean.
Heart Rate and Rhythm Basics
Your resting heart rate usually falls between 60 and 100 beats per minute. Athletes often keep it lower—around 40 to 60 bpm—because their hearts work more efficiently. The small changes in time between each heartbeat, called heart rate variability that show how well your autonomic nervous system is functioning.
Stroke Volume
With every beat, our heart pushes about 70 mL of blood out of the left ventricle. This amount is called the stroke volume. When we multiply stroke volume by heart rate, we get cardiac output. In a healthy adult weighing around 70 kg, cardiac output usually stays between 4 and 8 liters per minute at rest. However, it can surge past 20 liters per minute during intense exercise.
Simple Cardiac Output Calculator Example:
- Heart Rate: 70 bpm
- Stroke Volume: 70 mL
- Cardiac Output: 70 × 70 = 4,900 mL/min (4.9 L/min)
Chamber Pressures
- Right Atrial Pressure: The right atrial pressure normally stays between 0–8 mmHg. When it rises, it usually points to fluid overload, right-sided heart failure, or tricuspid valve problems. On physical exam, this pressure matches what you see as jugular vein distension.
- Right Ventricular Systolic Pressure: It ranges from 15–30 mmHg. If it goes higher, it signals pulmonary hypertension. If it drops lower, it suggests the right ventricle isn’t working well. Because the right ventricle has thin walls, it can’t handle high pressures for long without failing.
- Left Ventricular Systolic Pressure: It normally sits between 90–140 mmHg, which directly reflects your systolic blood pressure. The strong muscular walls of the left ventricle create this force so it can push blood against systemic vascular resistance.
- Aortic Pressures: It shows two key values. Systolic pressure (90–140 mmHg) reveals how powerfully the left ventricle contracts. Diastolic pressure (60–90 mmHg) shows how elastic the arteries are and how much resistance they give to blood flow.
Ejection Fraction
Ejection fraction (EF) tells us how much blood the heart pumps out with every beat. A healthy EF usually falls between 50% and 70%. When EF drops below 40%, it signals systolic heart failure. But if EF stays normal and symptoms still appear, it points to diastolic dysfunction.
EF Categories and Clinical Meaning:
- Normal: 50-70% (healthy heart function)
- Mildly reduced: 40-49% (early dysfunction)
- Moderately reduced: 30-39% (significant impairment)
- Severely reduced: <30% (advanced heart failure)
If you want a more understanding of how the heart works, the Guyton and Hall Textbook of Medical Physiology explains hemodynamic principles in detail. It presents the concepts clearly, making them easy to grasp for both students and healthcare professionals.
Pressure-Volume Loops: The Heart’s Performance Curve
The pressure-volume loop of the heart shows that how the chamber’s pressure and volume shift during each heartbeat. By studying this loop, we can clearly tell the difference between systolic and diastolic heart failure.
- Normal Loop: In a normal loop, the heart fills and pumps blood efficiently, showing healthy pressure–volume patterns.
- Systolic Heart Failure Loop: The heart loses pumping strength, leading to a smaller stroke volume and a higher end-systolic volume.
- Diastolic Heart Failure Loop: The heart struggles to relax, so filling pressures rise even though the ejection fraction stays normal.
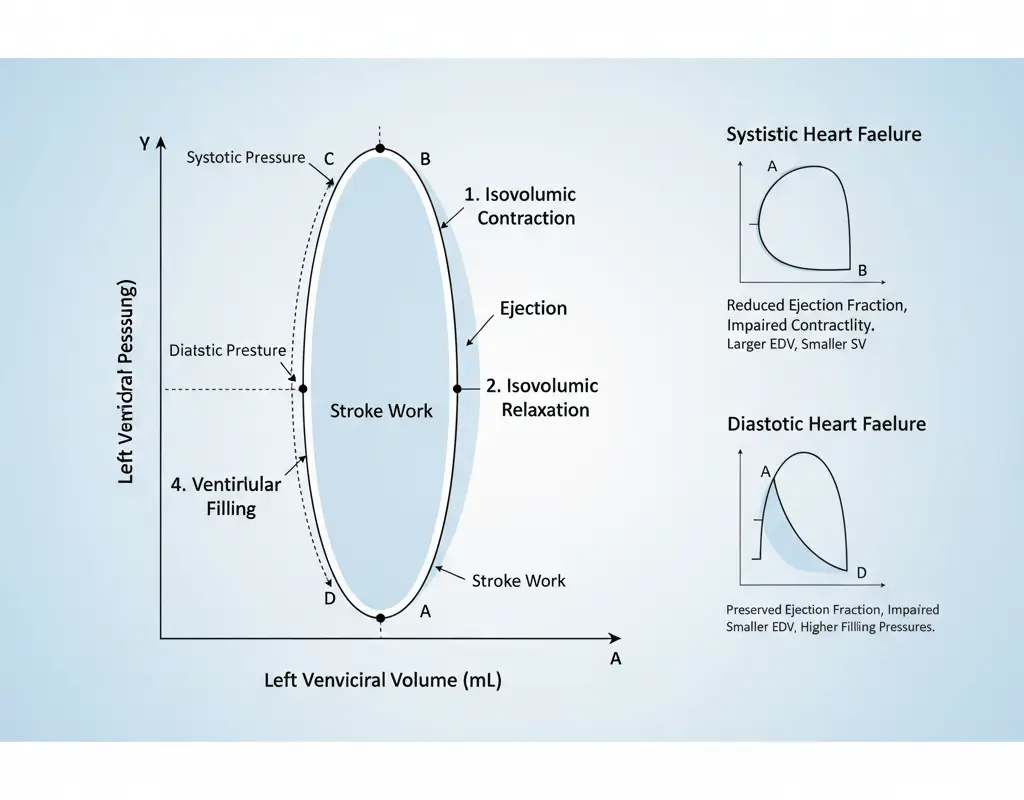
By studying these loops, doctors can better target the exact problem and choose the right treatment for heart failure.
Conduction System to ECG Mapping
The heart’s electrical system controls its pumping by using a smart network of special cells. When you understand how human heart anatomy connects with an ECG, you can more easily read rhythmic strips. This helps you spot any problems in the heart’s conduction system.
Electrical Pathway Overview
- Sinoatrial (SA) Node: Found in the right atrial wall near the superior vena cava, acts as the heart’s natural pacemaker. It generates impulses at a rate of 60–100 beats per minute. When the SA node doesn’t work properly, the heart may slow down (bradycardia) or beat irregularly (atrial fibrillation).
- Atrioventricular (AV) Node: Located between the atria and ventricles, slows down the electrical signal for about 0.1–0.2 seconds. This short pause gives the atria enough time to empty blood into the ventricles. If the AV node delays the signal too much, it leads to an AV block.
- His-Purkinje System: Carries the impulses quickly through the interventricular septum. It spreads them across the ventricular walls at a speed of 2–4 meters per second. This rapid conduction makes sure both ventricles contract together in perfect sync.
Conduction Velocities and Clinical Significance
Different cardiac tissues conduct electrical impulses at changing speeds:
- Atrial muscle: 1 m/s
- AV node: 0.05 m/s (slowest—creates physiological delay)
- His-Purkinje: 2-4 m/s (fastest—ensures rapid ventricular activation)
- Ventricular muscle: 0.5 m/s
These velocity differences create the characteristic ECG waveforms. When conduction slows down or gets blocked, the normal pattern changes, making it easier to spot and locate heart problems.
Coronary Supply to ECG Territory Mapping
When you know which coronary artery supplies each part of the heart, you can predict the ECG changes easily. These changes appear during a heart attack.
Coronary Territory ECG Correlation Table:
| Coronary Artery | Wall Territory | ECG Leads | Typical MI Findings |
|---|---|---|---|
| LAD | Anterior wall, septum | V1-V4, sometimes V5-V6 | ST elevation in anterior leads, possible Q waves |
| RCA | Inferior wall, posterior wall | II, III, aVF (inferior); V7-V9 (posterior) | ST elevation in inferior leads, reciprocal changes |
| LCx | Lateral wall, sometimes posterior | I, aVL, V5-V6 | Lateral ST changes, often subtle |
| LM | Extensive anterior | Multiple leads | Widespread ST changes, cardiogenic shock risk |
When a patient comes in with chest pain and the ECG shows ST elevation in leads II, III, and aVF, it usually points to an RCA blockage affecting the heart’s inferior wall. The reciprocal ST depression in leads I and aVL further confirms this diagnosis.
ECG Interpretation Made Incredibly Easy helps readers practice with real cases that link anatomy to actual ECG patterns. This makes the book a valuable guide for both healthcare students and professionals.
Coronary Anatomy and Clinical Relevance
The areas supplied by the coronary arteries shape how severe coronary artery disease can be and what effects it causes. Each of the three main coronary vessels feeds a specific part of the heart muscle. Understanding this anatomy is important for grasping symptoms and clinical signs.
Left Anterior Descending (LAD) Territory
The LAD feeds blood to the front wall of the left ventricle. It also supplies the front part of the interventricular septum, and often the heart’s apex. Doctors call it the ‘widow maker’. This is because a blockage near its start can cut off blood to a large portion of the heart muscle.
Why LAD Lesions Are More Dangerous:
- Supplies the largest portion of left ventricular muscle mass
- Occlusion often causes extensive anterior wall motion abnormalities
- Higher risk of cardiogenic shock and mechanical complications
- Frequent involvement of the conduction system through septal branches
Right Coronary Artery (RCA) Territory
The RCA directly supplies blood to the inferior wall of the left ventricle. It also supplies blood to the free wall of the right ventricle and the posterior wall in right-dominant systems. When the RCA develops blockages, it often leads to inferior wall heart attacks.
RCA Dominance Implications:
- Right dominance (85% of people): RCA supplies posterior wall and inferior LV
- Left dominance (8%): LCx supplies posterior wall
- Co-dominance (7%): Both RCA and LCx contribute to posterior circulation
Left Circumflex (LCx) Territory
The LCx carries blood to the lateral wall of the left ventricle and the left atrium. In a left-dominant heart, it also sends blood to the posterior and inferior walls.
Clinical Significance:
- LCx lesions often produce “silent” ischemia due to fewer ECG leads monitoring lateral wall
- Obtuse marginal branches supply high-risk lateral territory
- Left main involvement affects both LAD and LCx distributions
Collateral Circulation Development
When the coronary arteries stay narrowed for a long time, the heart begins to grow new collateral vessels. These natural bypass routes help keep blood flowing and protect the heart muscle. Well-formed collaterals often explain why some people with severe coronary disease feel no symptoms at all.
By understanding coronary anatomy, doctors can better predict which treatments will help the most. For example, opening the LAD with a stent usually gives more relief than treating the RCA, since the LAD supplies a larger area of the heart.
How Anatomy Looks on Imaging: Echo, CT, MRI
Modern cardiac imaging shows the heart’s structure and how it works. Learning about heart anatomy through echocardiography and other imaging methods helps you understand test results and guides better clinical decisions.
Echocardiography: The Cardiac Ultrasound
Echocardiography uses ultrasound waves to create live images of the heart, showing its structure and how it works. By using different imaging angles, doctors can view specific parts of the heart clearly.
Apical Four-Chamber View:
In this common view, you can see all four chambers of the heart at once. The left ventricle appears on the right side of the screen, and the right ventricle appears on the left. You can also clearly see the mitral and tricuspid valves. This visibility helps check how well the valves are working. It also helps check the size of each chamber.
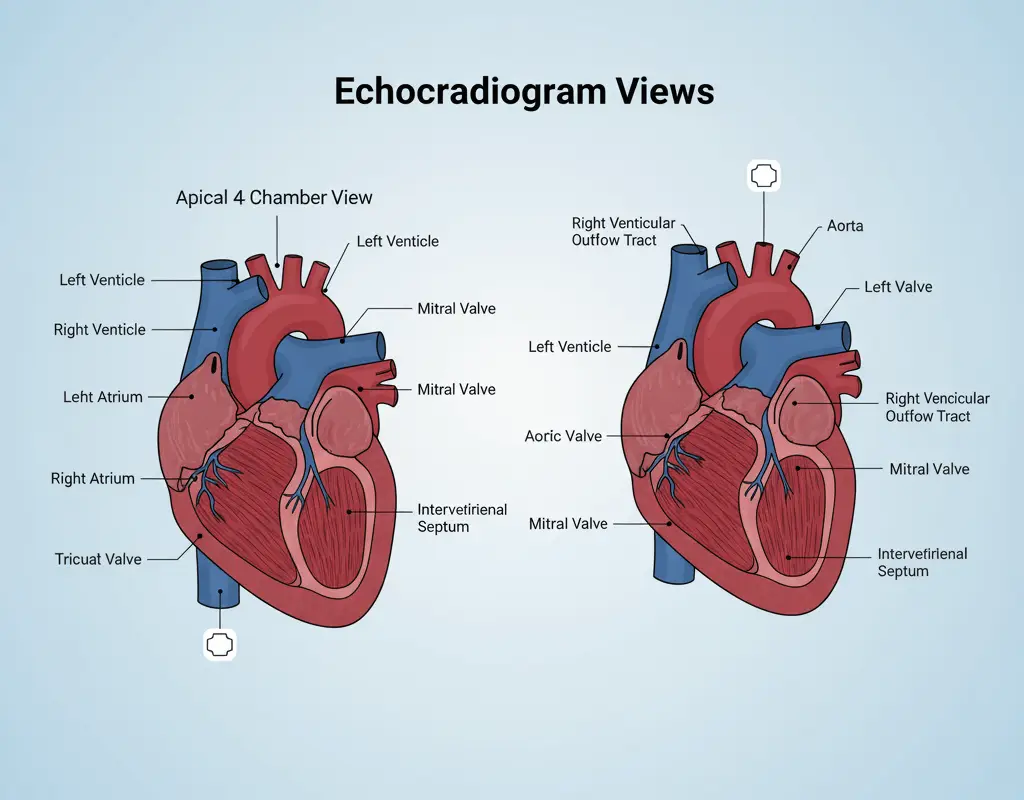
Parasternal Long-Axis View:
This view shows the left ventricle, left atrium, aortic valve, and ascending aorta from the side. It’s great for measuring chamber sizes, wall thickness, and the aortic root. You can also see parts of the right ventricle outflow tract and pulmonary valve.
Key Echo Measurements:
- Left ventricular ejection fraction (normal >55%)
- Wall motion abnormalities (indicating coronary disease)
- Valve gradients (measuring stenosis severity)
- Chamber sizes (detecting enlargement)
- Diastolic function parameters (assessing filling patterns)
Cardiac CT: Detailed Anatomical Imaging
Coronary CT Angiography: This test uses a special contrast dye and a fast CT scan to look at the coronary arteries. It helps doctors spot calcium build-up, plaques that don’t block blood flow, and unusual artery shapes.
Clinical Applications:
- Ruling out coronary disease in low-risk chest pain patients
- Detecting coronary anomalies before surgery
- Planning complex interventional procedures
- Assessing bypass graft patency
Cardiac MRI: The Gold Standard for Tissue Characterization
When Cardiac MRI Is Used:
- Myocarditis diagnosis (detecting inflammation and edema)
- Scar tissue identification (late gadolinium enhancement)
- Precise volume and function measurements
- Congenital heart disease evaluation
- Cardiac mass characterization
MRI Advantages:
- No radiation exposure
- Excellent soft tissue contrast
- Accurate volume calculations
- Functional and anatomical information in one study
Cardiac Imaging Comparison Table:
| Clinical Scenario | Echocardiography | Cardiac CT | Cardiac MRI |
|---|---|---|---|
| Chest pain evaluation | First-line for wall motion | Best for coronary anatomy | Limited role in acute setting |
| Heart failure assessment | Preferred – EF, wall motion, valves | Limited utility | Gold standard for volumes/EF |
| Valve disease evaluation | First choice – real-time function | Pre-surgical planning | Best for regurgitation quantification |
| Coronary artery disease | Stress echo for ischemia | Excellent – non-invasive angiography | Stress perfusion imaging |
| Congenital heart disease | Good for simple defects | Excellent 3D anatomy | Gold standard complex cases |
| Myocarditis/Pericarditis | Limited tissue characterization | Some utility for complications | Best choice – tissue characterization |
| Cardiac masses | Good screening tool | Excellent for location/size | Best for tissue characterization |
| Aortic disease | Limited to root/ascending | Excellent – entire aorta | Good for aortic dimensions |
| Pre-operative planning | Basic screening | Excellent surgical roadmap | Best for complex procedures |
| Follow-up monitoring | Ideal – no radiation, portable | Limited due to radiation | Reserved for specific indications |
Echocardiography Review Guide helps healthcare professionals to confidently interpret cardiac images. It teaches clear, step-by-step methods for reading studies while connecting what you see to heart anatomy.
Common Heart Problems Explained Through Anatomy
Knowing how a healthy heart works makes it easier to understand heart diseases. Many heart conditions follow predictable patterns based on anatomy, which helps doctors diagnose and plan treatment.
Heart Attacks: How They Happen and Where They Strike
A heart attack occurs when a coronary artery gets blocked, cutting off blood to a specific part of the heart. The area affected depends on which artery is blocked and how well the heart’s backup circulation works.
Anterior STEMI (LAD Blockage):
- Damages the front wall and septum of the heart
- Shows changes on ECG leads V1-V6
- Increases risk of heart failure and shock
- Can affect the heart’s electrical system
Inferior STEMI (RCA Blockage):
- Damages the lower wall of the left ventricle
- Shows changes on ECG leads II, III, aVF
- May involve the right ventricle if the blockage is high
- Raises the risk of complete heart block
Lateral STEMI (LCx Blockage):
- Affects the side wall of the left ventricle
- Shows changes on ECG leads I, aVL, V5-V6
- Sometimes hard to see on a standard ECG
- Can lead to mitral valve leakage
Valve Problems: Why Heart Geometry Matters
Heart valves work because their parts fit together perfectly. If this geometry changes, valves can narrow (stenosis) or leak (regurgitation).
Mitral Regurgitation (MR):
- The mitral valve includes leaflets, chords, papillary muscles, and the annulus
- If any part malfunctions, blood leaks backward
- Ischemic MR happens when papillary muscles fail, and degenerative MR occurs when leaflets prolapse
Aortic Stenosis (AS):
- Calcium buildup stiffens the valve and narrows the opening
- The left ventricle thickens to keep pumping blood
- Symptoms appear only in advanced stages
Heart Failure: Systolic vs Diastolic
Heart failure happens when the heart can’t pump blood well. Knowing the anatomy helps guide treatment.
Systolic Heart Failure:
- The heart squeezes weakly, lowering ejection fraction (<40%)
- The left ventricle dilates and walls thin
- Often follows a heart attack
Diastolic Heart Failure:
- The heart squeezes normally (ejection fraction >50%) but can’t relax
- Walls become thick and stiff
- Common in older adults with high blood pressure
Congenital Heart Defects: Born Differences
Some heart problems start before birth, when the heart forms incorrectly. These defects can last into adulthood.
Ventricular Septal Defect (VSD):
- A hole in the wall between the ventricles lets blood flow left-to-right
- Small holes may close on their own
- Large holes overload the heart and can cause high blood pressure in the lungs
Atrial Septal Defect (ASD):
- A hole in the wall between the atria also lets blood flow left-to-right
- Most remain symptom-free until adulthood
- Can lead to right heart failure later in life
Anatomy and Interventions: PCI, CABG, Valve Repair, TAVR
Modern heart procedures change the structure of the heart to bring it back to its normal function. To understand these treatments, you need to know how a healthy heart is built and how diseases can change its anatomy.
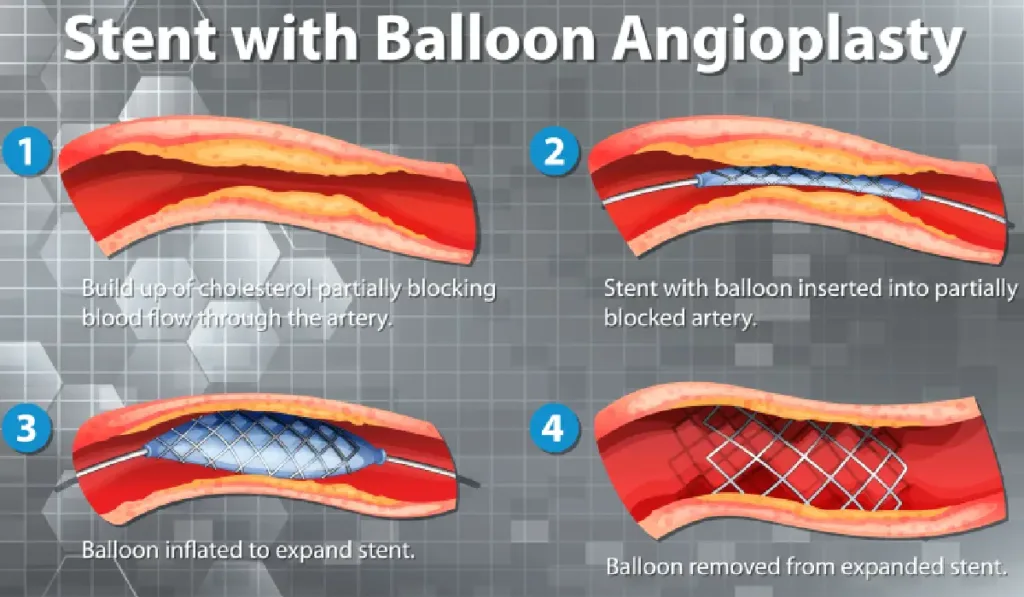
Percutaneous Coronary Intervention
PCI treats blocked coronary arteries using catheters. Doctors use a balloon angioplasty to push plaque against the artery walls, and then place a stent to keep the artery open permanently.
Stent Placement Basics:
- Drug-eluting stents release medications to prevent restenosis
- Stent sizing must match vessel diameter and lesion length
- Multiple stents may be needed for long lesions
- Side branch protection sometimes requires complex techniques
Anatomical Considerations:
- Vessel tortuosity affects catheter navigation
- Calcified lesions may require atherectomy before stenting
- Bifurcation lesions need specialized approaches
- Left main stenting carries higher procedural risk
Coronary Artery Bypass Grafting (CABG)
In CABG, surgeons use grafts from other blood vessels to create new routes around blocked coronary arteries. Arterial grafts, like the internal mammary or radial artery, usually stay open longer than vein grafts, such as the saphenous vein.
Graft Placement Strategy:
- Left internal mammary artery typically goes to LAD
- Right internal mammary artery may go to RCA or diagonal
- Saphenous vein grafts connect aorta to distal coronary vessels
- Sequential grafting maximizes graft utilization
Why Anatomy Determines Approach:
- Vessel size must accommodate graft diameter
- Target location affects graft route and length
- Competitive flow from native vessels can cause graft failure
- Patient anatomy influences surgical approach (sternotomy vs minimally invasive)
Valve Repair and Replacement
Valve procedures fix abnormal anatomy to restore normal blood flow. Surgeons repair the valve whenever possible to keep the patient’s own tissue. They use mechanical or biological prostheses only when replacement is needed.
Mitral Valve Repair:
- Quadrangular resection removes prolapsing tissue
- Artificial chordae replace ruptured native structures
- Annuloplasty rings restore normal valve geometry
- Edge-to-edge repair (MitraClip) approximates leaflets
Aortic Valve Replacement:
- Mechanical valves provide durability but require anticoagulation
- Biological valves avoid anticoagulation but have limited lifespan
- Valve-in-valve procedures treat failed biological valves
- Ross procedure uses pulmonary valve as aortic replacement
Transcatheter Aortic Valve Replacement (TAVR)
In TAVR, doctors use a catheter to place a prosthetic valve, so open-heart surgery isn’t needed. They carefully measure the human hearts anatomy to choose the right valve size and position it correctly.
Anatomical Requirements:
- Aortic annulus diameter determines valve size
- Root anatomy affects implantation approach
- Coronary height influences leaflet design
- Peripheral vessels must accommodate delivery systems
These interventions show how understanding normal anatomy guides treatment choice and predicts outcomes.
Micro → Macro: Cardiac Cell Structure & How It Powers the Pump
The heart works starting at the cellular level. Heart muscle cells, called cardiomyocytes, line up in an organized pattern. Intercalated discs connect these cells end-to-end. These discs have special junctions that let electrical signals travel quickly from one cell to the next. This fast signaling makes the whole heart contract in a smooth, coordinated rhythm.
Inside each cell, tiny repeating units called sarcomeres act as engines for contraction. They have proteins, actin and myosin, that slide past each other to make the muscle shorten. This process, called excitation–contraction coupling, happens when an electrical signal triggers the muscle to contract. For a detailed and clear explanation of this fascinating process, the book Valvular Heart Disease: A Companion to Braunwald’s Heart Disease is a great resource. It is available on Amazon and other major retailers.
Aging Heart: Expected Changes vs Pathology
Like every other organ, the heart changes as we age. These changes usually happen slowly and don’t always mean there is a disease. Common changes include:
- Large arteries become stiffer, which can raise blood pressure.
- Heart valves may develop calcium deposits, making them less flexible.
- The heart’s electrical signals can slow down, sometimes causing a slightly slower resting heart rate or an occasional skipped beat.
These changes are a normal part of aging, but they can increase the risk of certain heart problems. Staying active, eating a balanced diet, and maintaining a healthy lifestyle can help keep your heart strong.
Conclusion
The human heart is a marvel of nature, and its anatomy reveals a lot about its health. When you learn the main parts—such as the chambers, valves, conduction system, and coronary arteries—you can understand your medical test results better. You can talk more confidently with your doctor. Taking the time to know how your heart works is the first and most powerful step toward keeping it healthy.
Now that you know more about your heart, why not put your knowledge to the test? Try our interactive science quiz and see what you’ve learned!
Frequently Asked Questions About the Human Heart
The heart pumps blood through a coordinated cycle of contraction (systole) and relaxation (diastole). Blood flows from the atria to the ventricles, then through the pulmonary artery to the lungs and the aorta to the rest of the body, supplying oxygen and nutrients.
The heart has four chambers:
1. Right atrium – receives deoxygenated blood from the body
2. Right ventricle – pumps blood to the lungs
3. Left atrium – receives oxygenated blood from the lungs
4. Left ventricle – pumps oxygen-rich blood to the body
The left ventricle has a thicker muscular wall because it must generate enough pressure to pump blood throughout the entire body, unlike the right ventricle, which only pumps to the nearby lungs.
Some common conditions include coronary artery disease (CAD), arrhythmias, heart failure, and valve disorders. Warning signs may include chest pain, shortness of breath, palpitations, fatigue, or swelling in the legs.
Following are some modern heart treatments:
1. 3D bioprinting repairs damaged tissue.
2. Artificial hearts and LVADs support failing hearts.
3. Stem cell therapy is being tested for regenerating heart muscle.
4. AI algorithms assist in early detection of arrhythmias and optimize imaging analysis.
References
- Guyton & Hall. Textbook of Medical Physiology, 14th Edition.
- American Heart Association. www.heart.org
- Mayo Clinic. Heart Disease Resources. www.mayoclinic.org
- National Heart, Lung, and Blood Institute (NHLBI). www.nhlbi.nih.gov
- Mozaffarian D, et al. Dietary and lifestyle risk factors for cardiovascular disease. Circulation.