The position of garbage in the waters of the North Pacific Ocean has increased dramatically over the past few decades. Imagine you are on a research trip with a team, and you are standing on the deck of a research vessel 1,000 miles off the coast. And when you see water spreading everywhere, you will definitely want to take a dip in it. But suddenly, when you look into the water, you feel a little worried. What is the reason for that worry? It is this garbage, which contains plastic bottles, fish nets, and countless small particles, that are making the seawater dirty. This is the Great Pacific Garbage Patch, a vast accumulation of plastic pollution that has been growing rapidly over the decades.
According to one estimate, this massive zone covers about 1.6 million square kilometers, which is twice the area of Texas, and contains about 80,000 tons of marine plastic, which is certainly affecting marine animals and is certainly causing global food shortages.
In this comprehensive guide, you will discover that:
- What the GPGP truly is—and how it forms
- Where the plastic originates (not just ships, I promise)
- Its impact on marine ecosystems, human health, and coastal economies
- Cleanup technologies vs prevention strategies
- What you can do to be part of the solution
Stay with me – hope is buried in these currents, and we will ride it together.
Below is a one-page infographic that you can download for a quick and visual snapshot of the problem—and keep reading for the full details.
Great Pacific Garbage Patch Fast Facts & Action Guide
How the Patch Forms: Gyres, Currents & Transport
Understanding the Great Pacific Garbage Patch requires a deep understanding of the physics of ocean currents, as the patch lies within the North Pacific Subtropical Gyre – a vast circular current system stretching thousands of miles.
Ocean gyres act like slow-moving whirlpools. These surface currents, driven by wind patterns and the Earth’s rotation, create rotating systems that naturally concentrate floating material toward their center. The North Pacific Gyre is made up of four major currents: the North Pacific Current, the California Current, the North Equatorial Current, and the Cruceo Current.
Why Debris Accumulates in the North Pacific Gyre
The convergence zone of the gyre acts as a natural collection point. Plastic debris enters the ocean from coastal areas and rivers along the Pacific Rim. Once caught in the gyre system, the material slowly moves inward, concentrating in the relatively calm central waters, where it remains trapped for years or decades.

When wind patterns reinforce this concentration effect. The center of the gyre experiences light winds, creating conditions where floating debris remains rather than being dispersed by wave action. This explains why the patch maintains its position despite being constantly moved by the current.
Micro vs Macro Plastics: A Critical Distinction
The plastic in the patch can be classified into two main categories based on their sizes:
1. Macro plastics (larger than 5mm)
This includes larger debris items, such as fishing gear, bottles, crates, and containers. They are easily visible and make up a significant portion of the total mass.
2. Micro plastics (smaller than 5mm)
These tiny pieces make up more than 90% of all particles in the patch. They form when larger plastic objects break down under UV radiation, wave action, and biological processes. Microplastics are particularly worrisome because they are easily ingested by marine life and are difficult to remove during cleanup operations.
As plastic photodegrades in marine conditions, it rapidly disintegrates but never completely disappears, and persists in the marine environment for decades to centuries.
Where the Plastic Actually Comes From: Breakdown & Sources
Many people believe that the Great Pacific Garbage Patch comes from ships that are careless and throw waste overboard. This is true to some extent, but the reality is that the vast majority of plastic is produced on land. About 80% comes from land, flowing through rivers and coastal erosion, while the rest comes from ocean-based sources such as fishing. Let’s explore some main sources together.
1. Rivers & Coastal Cities
The primary route for land-based plastic to enter the ocean is through rivers. Rivers act as conveyor belts, carrying plastic waste from cities, towns, and improper landfills directly into the ocean. Studies by The Ocean Cleanup and others have identified the top contributing rivers, many of which are located in Asia. These rivers carry a high level of plastic pollution, a direct result of rapid economic growth combined with inadequate waste management infrastructure in the countries surrounding them. For example, a 2017 study estimated that more than 90 percent of all plastic entering the ocean globally comes from just 10 rivers.
- Yangtze River (China): 1.5 million tonnes annually
- Indus River (Pakistan): 164,000 tonnes annually
- Yellow River (China): 124,000 tonnes annually
- Hai Hi River (China): 91,000 tonnes annually
- Nile River (Egypt): 84,000 tonnes annually
- Ganges (India): 115,000 tonnes annually
- Pasig (Philippines): 40,000 tonnes annually
- Irrawaddy (Myanmar): 32,000 tonnes annually
- Mekong (Vietnam/Laos/Cambodia): 30,000 tonnes annually
- Amur (Russia/China): 38,000 tonnes annually
These rivers are at the top of the list because they pass through residential areas and industrial areas, due to which the waste that is sent into them is thrown away. They become polluted due to lack of waste management infrastructure.
2. Fishing Gear & Commercial Fishing Operations
Commercial fishing operations contribute up to 86% of the plastic mass to the Great Pacific Garbage Patch. This is a surprisingly high percentage, which suggests several new factors:
- Net Durability: Fishing nets are designed to withstand harsh oceanic conditions, making them extremely persistent when lost
- Intentional Discarding: “Ghost gear” results from nets being cut loose during storms or equipment conflicts
- Large Size: Individual fishing nets contribute significantly more mass than consumer plastics
Lost fishing gear continues to trap marine life long after abandonment, creating ongoing ecological damage through “ghost fishing” effects. Modern fishing operations in the North Pacific lose an estimated 640,000 tonnes of gear annually.
3. Ocean-Based Sources vs. Land-Based Sources
The plastic in the GPGP can be categorized into two main origin points:
Ocean-based sources (20% of total):
- Commercial fishing operations (dominant contributor by mass)
- Cargo ships and container losses
- Naval and research vessel operations
- Offshore platforms and aquaculture facilities
Land-based sources (80% of total):
- Single-use consumer packaging
- Inadequate waste management systems
- Industrial plastic pellet losses “nurdles””)
- Stormwater carrying urban debris
- Illegal dumping and landfill overflow
4. Microplastics Origins: The Invisible Part
Microplastics reach the GPGP through direct and indirect channels:
Primary microplastics enter the ocean already in microscopic form:
- Cosmetic microbeads (being phased out in many countries)
- Synthetic textile fibers released during washing
- Tire wear particles carried by stormwater
- Industrial plastic pellets
Secondary microplastics form in the ocean when larger items degrade:
- UV radiation breaks polymer bonds
- Wave action creates mechanical stress
- Marine organisms bite and fragment larger pieces
The ratio between primary and secondary microplastics in the patch remains under study, but evidence indicates that secondary formation dominates in the open ocean environment.

Ecological Impacts: Wildlife, Ecosystems & the Neuston
The Great Pacific Garbage Patch creates complex ecological consequences that extend far beyond simple pollution. Marine life interacts with this plastic accumulation in such ways that scientists are still discovering, with effects ranging from direct physical harm to invisible ecosystem-wide changes.
Ingestion & Entanglement: Direct Wildlife Impacts
Over 700 marine species have documented interactions with ocean plastic debris. The impacts fall into two primary categories:
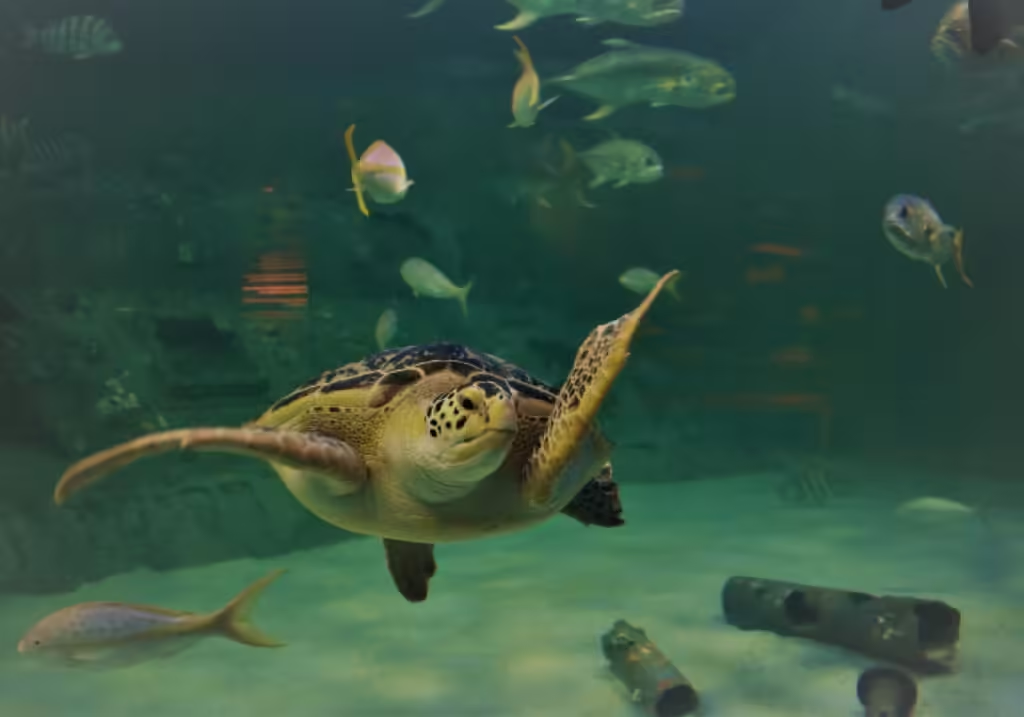
Ingestion effects occur when animals eat plastic for food by mistake. Sea turtles consume plastic bags, considering them as a jellyfish. Seabirds feed plastic fragments to their chicks, causing malnutrition and internal injuries. Research shows that microplastics can cause tissue damage, oxidative stress, and changes in immune-related gene expression in fish.
Critical ingestion statistics:
- 90% of seabirds have plastic in their stomachs
- 52% of sea turtles have consumed plastic debris
- 25% of fish in Pacific markets contain microplastics
Entanglement effects mainly involve larger debris, especially fishing gear. Marine animals become trapped in these ghost nets, leading to injury, inability to feed, and death. The problem is self-perpetuating: entangled animals often die and decompose, leaving the gear free to trap extra victims.
Neuston and Emerging Ecosystems on Debris
The ocean surface is home to a unique and fragile ecosystem called a neuston, which includes plankton, jellyfish, and other organisms that live on or near the water’s surface. Unfortunately, plastic debris has created a new, artificial habitat for some species. While some organisms, such as barnacles and crabs, colonize floating plastic and migrate to new locations, it can introduce invasive species into new environments, disrupting local ecosystems. This balance is becoming increasingly fragile and often points to harm.
Microplastics in the Food Web
When larger pieces of plastic break down, smaller pieces of plastic, called microplastics, are eaten by smaller creatures like plankton and baby fish at the bottom of the food chain. These smaller creatures are then eaten by larger fish, which are also eaten by larger animals. This process, called biomagnification, causes microplastics to build up more and more as you move up the food chain, eventually affecting the largest marine animals.
For more understanding into the marine food web and how it’s affected by pollution, the book Marine Biology: An Ecological Approach offers a comprehensive and accessible overview.
Human Health & Economic Impact: What We Know and What’s Uncertain
The Great Pacific Garbage Patch affects human communities through multiple ways, creating both immediate economic costs and longer-term health concerns that researchers are still working to understand.
1. Microplastics in Seafood
Humans indirectly ingest marine plastic through seafood. A recent study estimated that the average person consumes 39,000 to 52,000 microplastic particles per year through food sources alone, with seafood playing a key role. Shellfish are particularly at risk because they are prone to microplastic accumulation in coastal areas. While long-term health effects are still under investigation, early research suggests links to endocrine disruption and inflammatory responses.
2. Tourism & Fisheries
Plastic pollution also threatens coastal economies. Island nations that rely on pristine beaches, such as Hawaii, face millions of dollars in cleanup costs each year. The fishing industry suffers both direct damage to equipment (e.g., reduced production of ghost nets) and indirect consequences, such as declines in fish stocks. A case study from the Philippines estimates that plastic pollution is costing tourism and fisheries $1.3 billion annually.
3. Economic Burden on Nations
Globally, marine plastic pollution costs the economy between $6-19 billion annually. This figure includes lost tourism revenue, reduced fisheries yields, and cleanup efforts—funds that could otherwise support sustainable development.

4. Social Impact on Pacific Island Communities
For many Pacific Island communities, the ocean is not just a resource. It is the foundation of their culture and livelihoods. The influx of plastic debris disrupts traditional fishing practices, destroys coastal habitats, and threatens food security. It is not just an environmental problem but also a social and cultural one, directly affecting the well-being and resilience of these vulnerable populations. On a remote beach, a local fisherman, sifting through the debris with a look of despair, tells the story of a disrupted way of life.
Cleanup Technologies: What’s Being Tried & Real Costs
The challenge of removing plastic from the Great Pacific Garbage Patch has given rise to innovative technical approaches, each with its own advantages, limitations, and cost implications. Current efforts focus on both active removal and upstream prevention strategies. Let’s take a look at a few.
1. The Ocean Cleanup Systems
The Ocean Cleanup system was designed by Dutch inventor Boyan Slat. He has developed the most ambitious direct removal approach. Their System 03 shows the latest iteration of passive collection technology designed specifically for open-ocean environments.
How the technology works:
- U-shaped boom system extends 2.5 kilometers across ocean surface
- Natural ocean currents push plastic into the system faster than the system itself moves
- Concentrated plastic gets collected in retention zone at the center
- Support vessels extract accumulated plastic every few months
Current performance metrics:
- Target removal rate: 100 kilograms per hour
- Operational uptime: 70% (weather and maintenance downtime affect efficiency)
- Projected need: 10 full-size systems to clean the entire patch
Cost analysis:
- Total project cost: $7.5 billion for full patch cleanup
- Individual system cost: $25-30 million including vessel operations
- Cost per tonne removed: $94,000-150,000 depending on efficiency
The technology has proven that large-scale plastic removal is technically possible, though economic viability remains challenging as compared to prevention approaches.
2. River Interceptors
Prevention-focused technologies aim to stop plastic before it reaches the ocean, potentially offering greater cost-effectiveness than open-ocean cleanups. River Interceptor systems have deployed at strategic river mouths that can capture plastic waste flowing downstream. This system includes:
- Interceptor systems that cost $750,000-$2.5 million per unit
- Capacity: 50,000 tonnes per year in optimal conditions
- Proven effectiveness: 80% capture rate for floating debris
- Operational cost: $150,000-300,000 annually per system
Onshore waste management solutions include:
- Automated sorting facilities using AI and robotics
- Plastic-to-fuel conversion plants at waste processing centers
- Community-based waste collection incentive programs
- Advanced recycling technologies that handle contaminated plastics
These upstream interventions typically cost $1,000-3,000 per ton prevented from entering the ocean – significantly less expensive than removal from the open ocean.
3. Risks & Critiques
Large-scale cleanup operations raise legitimate environmental concerns that must be addressed in technological development:
Pros of current cleanup approaches:
- Proven ability to remove significant plastic quantities
- Continuous technological improvement reducing costs
- Positive public engagement and funding attraction
- Data collection advancing scientific understanding
Cons and risks requiring attention:
- Neuston bycatch: Surface ecosystems may be disrupted by collection systems
- Microplastic fragmentation: Collection processes may break larger pieces into harder-to-remove fragments
- Energy intensity: Current systems need significant fossil fuel consumption
- Scale limitations: Even optimistic projections tackle only a fraction of total ocean plastic
The impact of the mechanism on the environment is still being assessed. Studies show that well-designed systems can reduce damage to nature, but a full environmental assessment is needed before work can be expanded. Environmental scientists continue to debate whether cleanup or prevention is better. Most agree on a balanced approach that focuses on preventing damage while cleaning up heavily contaminated areas.

Prevention & Policy: Upstream Solutions that Save Money
While cleanup technologies capture the public imagination, prevention strategies offer the most cost-effective and environmentally sound way to tackle marine plastic pollution. Upstream interventions can remove the need for costly removal operations while creating economic opportunities.
1. Waste Management Infrastructure
Investing in robust waste management systems in high-contribution regions provides the greatest return on investment for plastic pollution prevention.
Infrastructure investment requirements:
- Collection systems: $200-500 per person served annually
- Processing facilities: $50-150 million per 500,000-tonne capacity plant
- Transportation networks: $25-75 million per regional system
- Employee training and technical support: $2-5 million annually per system
Economic benefits of proper waste management infrastructure:
- Reduced ocean cleanup costs: $50-200 million saved per region
- Tourism revenue protection: $100-500 million preserved annually
- Fisheries impact prevention: $75-300 million in avoided losses
- Healthcare cost reduction: $25-100 million from reduced pollution exposure
Case studies from Southeast Asia show that every dollar invested in waste management infrastructure saves $3-7 in avoided ocean plastic impacts. The Philippines’ integrated waste management program reduced ocean plastic entry by 65% over five years at a cost of $2.3 billion, while avoiding an estimated $8.1 billion in cleanup and economic damage costs.
2. Policy Levers: Deposit-Return Systems, Single-Use Bans, and EPR
Governments can play a major role by implementing smart policies:
- Deposit-Return Systems: These systems incentivize consumers to return plastic bottles and containers for a small refund, and it is dramatically increasing recycling rates.
- Single-Use Bans: Banning or restricting common single-use plastics like bags, straws, and cutlery directly reduces the amount of plastic entering the waste stream.
- Extended Producer Responsibility (EPR): EPR policies hold producers accountable for the entire lifecycle of their products, from design to disposal. This encourages companies to use less packaging and design products that are easier to recycle.
3. Corporate Responsibility & Supply-Chain Fixes
Corporations have a major role to play in the solution. This includes:
- Packaging Redesign: Switching to sustainable, reusable, or fully recyclable packaging materials.
- Supply Chain Audits: Ensuring that plastic waste is managed responsibly throughout the entire production and distribution process.
- Support for Circular Economy: Investing in technologies and systems that turn plastic waste into a valuable resource rather than a disposable one.
What You Can Do: A Practical Roadmap
While large-scale policies matter, individuals can still make measurable contributions:
- Refuse single-use plastics: Say no to plastic bags, straws, and cutlery.
- Choose reusables: Carry a reusable water bottle, coffee cup, and shopping bags.
- Support sustainable brands: Vote with your wallet and support companies committed to reducing their plastic footprint.
- Filter your laundry: Use a laundry bag or filter to capture microfibers from synthetic clothes.
- Join in cleanups: Join local beach or river cleanups.
- Vote for change: Support policies and politicians who advocate for strong environmental protections.
- Donate wisely: Support reputable organizations like The Ocean Cleanup or local conservation groups.
- Educate others: Share what you’ve learned with friends and family.
- Write a letter to a company: Encourage brands you use to reduce their plastic packaging.
- Lobby your local government: Advocate for better recycling programs or single-use plastic bans.
Pro Tip: Download our one-page infographic “10 Real Actions to Fight Plastic Pollution” and keep it handy as a daily reminder to live plastic-smart.
How to run a low-cost beach cleanup that collects data?
You can turn a cleanup into a powerful data-gathering event. Simply use a data-collection app or spreadsheet template to document what you find. This data can then be collected into a global database, helping scientists understand the sources of pollution and better inform policy decisions.
Conclusion
The Great Pacific Garbage Patch is both our greatest environmental mistake and our greatest opportunity yet to show that great global problems can be solved with global cooperation. The numbers are overwhelming: 1.8 trillion pieces of garbage, 79,000 tons of plastics, a patch of sea twice the size of Texas. And what has followed is perhaps more remarkable: unprecedented clean-up technologies, new solutions of prevention, and growing global awareness driving policy action.
Tomorrow is about urgency and possibility. Every piece of plastic avoided in our oceans this day spares marine habitats years from now. And every local policy change sets precedents that can go global. Every individual choice to refuse single-use plastics demonstrates market demand for green alternatives.
Decades were needed to build the Great Pacific Garbage Patch, but technologies to remediate it—from river interception centers to extended producer responsibility programs—are at our disposal within years. It is not if we can do it, but at what speed we choose to do it.
Think you know the oceans? Try our Ocean Challenge Quiz and put your knowledge to the test.
Recommended Reads for Curious Minds
- Plastic Ocean: How a Sea Captain’s Chance Discovery Launched a Determined Quest to Save the Oceans by Captain Charles Moore
- Plastic-Free: How I Kicked the Plastic Habit and How You Can Too by Beth Terry
- Global Impacts of Micro- and Nano-plastic Pollution by Nisha Gaur
- Thicker Than Water: The Quest for Solutions to the Plastic Crisis by Erica Cirino
Answering Common Questions and Misconceptions
No. The patch is better described as a “plastic soup”—a dispersed area where plastic concentration is higher than surrounding waters. Most debris consists of microplastics invisible from planes. The patch has no clearly defined edges and varies in density throughout its area.
Unfortunately, no. The scale is too large. Removal efforts like The Ocean Cleanup are important, but they must be paired with upstream prevention to be effective.
Research is ongoing, but microplastics are found in seafood with health impacts still uncertain. Some 2024 studies suggest potential links to cardiovascular problems, but the full risk picture remains unclear. Eating a diverse diet and choosing seafood from less polluted waters may reduce exposure.
There is a risk of bycatch, but organizations like The Ocean Cleanup are actively working to mitigate this through careful design and monitoring. The long-term harm of leaving the plastic in the ocean is far greater.
Small actions by individuals add up to a big impact. When one person uses reusable items, they can stop hundreds of plastic pieces from ending up in the ocean each year. Even more importantly, individual choices affect what people want to buy, how companies behave, and what society accepts, leading to bigger changes.