
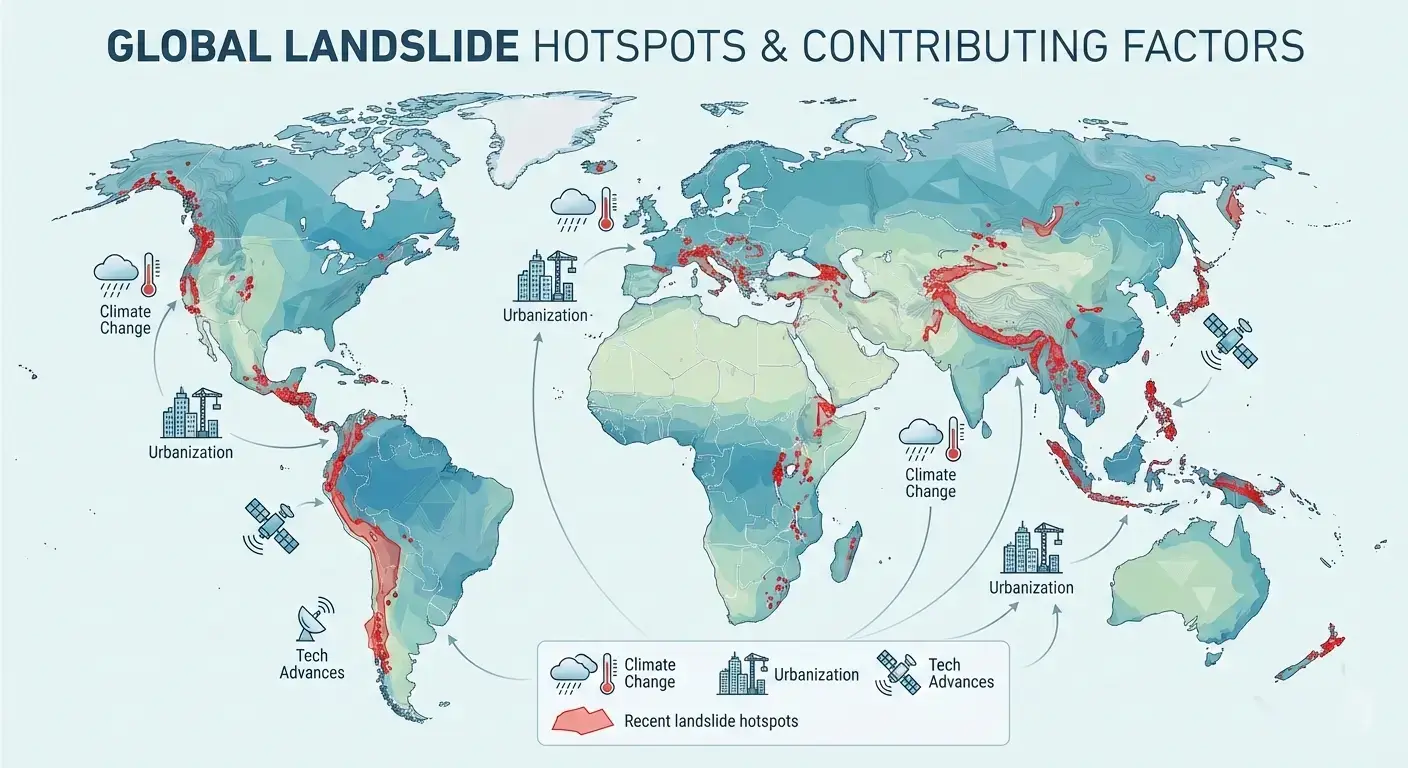
The ground beneath our feet may seem stable, but in many regions, it is constantly shifting. As climate change speeds up and cities expand into hilly and mountainous areas, landslides are happening more often and with greater force. This growing threat calls for smarter and more reliable tools to understand natural hazards. For years, most risk models have focused on surface factors like slope angle and rainfall. While useful, these models often overlook what lies deeper below the surface—the geological “DNA” of the land. As a result, their predictions can fall short. This is where the geological complexity index (GCI) makes a real difference. Instead of relying on a few basic variables, GCI uses a multi-parameter approach. It considers tectonic history, variations in rock types, and the strength of underground structures. By connecting these deeper factors, the geological complexity index is reshaping landslide risk modeling. It is also helping scientists predict hazards with greater confidence and clarity.
Why Geological Complexity Index Matters Now
We are now living in the age of cascading disasters. One heavy rainfall no longer causes just a flood. In high-altitude or geologically active regions, it often sets off a chain reaction. Slopes collapse. Land shifts. Entire landscapes fail in sequence.
For decades, scientists focused mainly on the trigger. Rainfall. Earthquakes. Extreme weather. Meanwhile, the ground beneath was treated as something stable and uniform. But thanks to modern remote sensing and GIS modeling, we now know that assumption was wrong. The Earth is not uniform at all. It is layered, fractured, and constantly evolving.
This is where the Geological Complexity Index comes in. It offers a way to measure the hidden “inner chaos” of the terrain. Yes, a steep slope is risky. But a steep slope made of fractured limestone, resting on an active fault line, is far more dangerous. GCI captures this difference. It assigns a numerical value to geological complexity, adding a deeper and more realistic dimension to landslide risk assessment.
And this matters now more than ever. Traditional models are reaching their limits. Adding more rainfall data alone no longer improves predictions significantly. To truly boost accuracy, we need to understand how complex the ground itself is.
GCI is not just another tool for terrain research. It is becoming a life-saving foundation for the next generation of early warning systems.
What Is the Geological Complexity Index?
At its core, the geological complexity index measures how unstable a geological environment really is. It does not rely on a single data point. Instead, it brings together several high-impact factors into one clear metric.
In other words, it looks at the big picture. It helps explain how a landscape is likely to behave when pressure builds. As stress increases, this combined view makes it easier to understand why some areas fail while others remain stable.
The Four Pillars of GCI
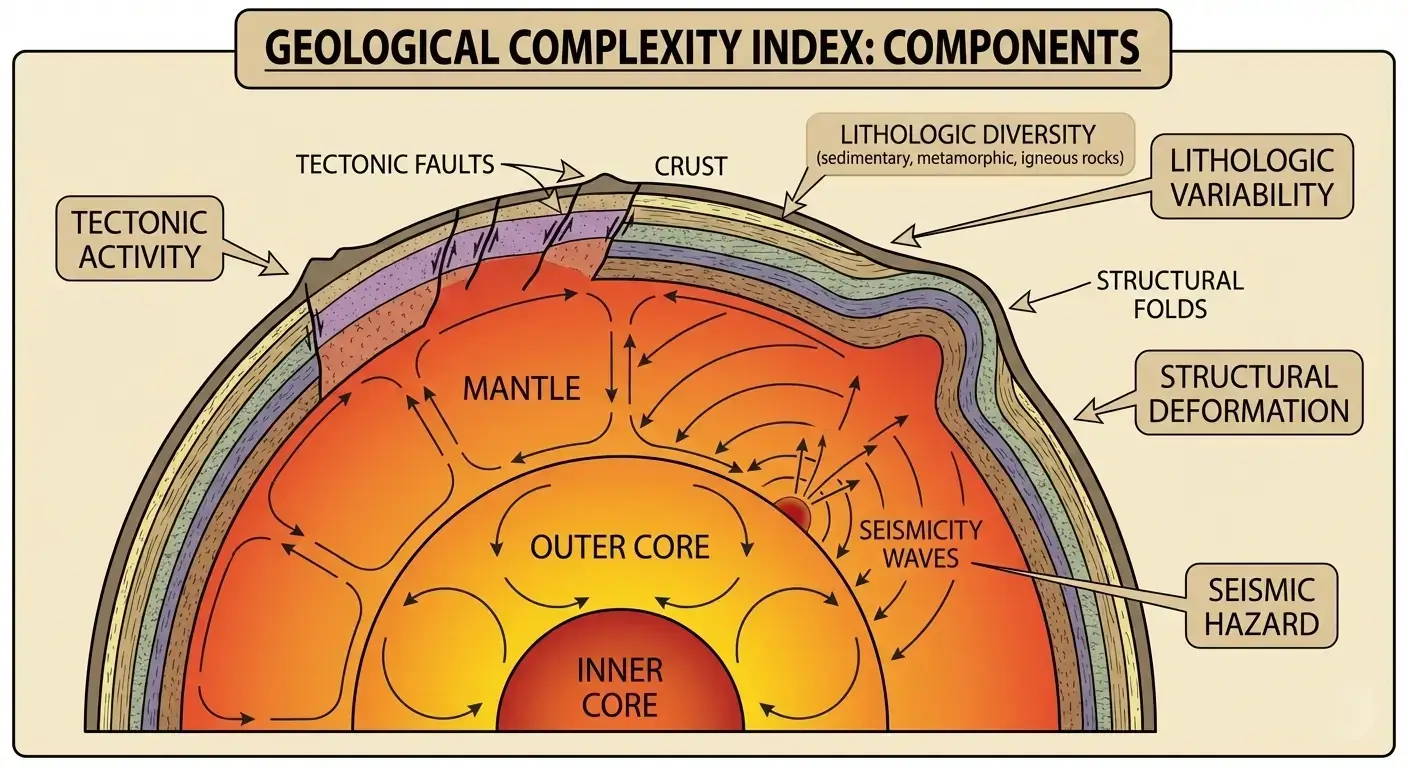
To understand GCI, we have to break it down into its constituent components. Think of these as the “ingredients” that define the volatility of the terrain:
- Tectonic Complexity: This measures the density and activity of fault lines. Regions with high fault density are naturally more fractured, creating pathways for water to infiltrate and weaken the rock mass.
- Lithologic Diversity: Not all rocks are created equal. This component looks at the variety of rock types in an area. High lithology diversity often means complex interfaces between different materials (e.g., hard granite meeting soft shale), which are prime locations for mechanical failure.
- Structural Complexity: This goes beyond just “faults” to look at the folding, tilting, and stratification of rock layers. How are the rocks oriented? If the layers (bedding planes) tilt toward the valley, they act like a slide, drastically increasing landslide risk.
- Seismicity: This accounts for the historical and potential earthquake activity. Constant seismic “rumbling” pre-weakens the geological structure, even if a major quake hasn’t happened recently.
How GCI is Calculated
Calculating the GCI is a feat of multi-parameter modeling. It typically utilizes the Analytic Hierarchy Process. In simple terms, AHP is a structured technique for organizing and analyzing complex decisions.
Researchers take data from Digital Elevation Models, satellite imagery, and field surveys, then assign “weights” to each pillar. For example, in a region known for massive earthquakes, the seismicity component might be weighted more heavily than lithologic diversity. By combining these weighted factors, we get a single, powerful index that represents the total geological “stress” of the area.
How GCI Improves Landslide Risk Modeling
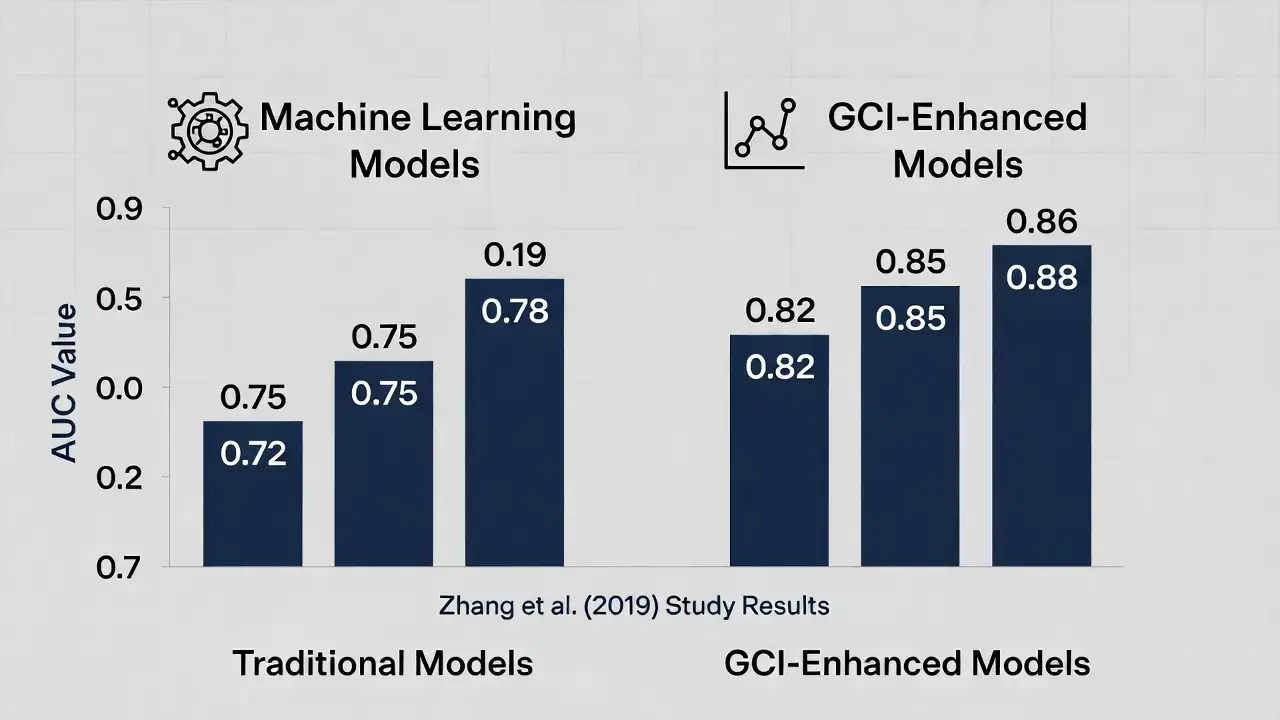
The evidence is clear in the data. Recent breakthroughs back this up. One standout example is Zhang’s study on landslide susceptibility in mountainous reservoir regions. The research shows that adding the geological complexity index greatly improves prediction accuracy. In fact, it outperforms traditional models by a noticeable margin.
Case Evidence: The Zhang Study Effect
In many traditional landslide risk modeling scenarios, the “Area Under the Curve” (AUC)—a standard metric for model success—often hovers around 0.7 to 0.8. However, when Zhang and his team integrated GCI into their hazard evaluation, the predictive power often jumped into the 0.85–0.92 range.
Why the massive jump? Because traditional models often struggle with “false positives” (predicting a slide where none occurs) or, more dangerously, “false negatives.” GCI refines the model by explaining why two identical-looking slopes behave differently. One slope might have a GCI of 0.3 (stable), while another—due to hidden faulting—might have a GCI of 0.8.
GCI vs. Traditional Machine Learning Models
We are now seeing a surge in machine learning applications in geology. While ML is great at finding patterns, it is only as good as the features you feed it.
- Standard ML Models: Feed them slope, aspect, and rainfall. They provide a decent heat map.
- GCI-Enhanced ML Models: Feed them the above PLUS the geological complexity. The model now understands the “structural fragility” of the land, leading to much sharper risk zoning.
Terrain and Geological Interactions
The relationship between terrain complexity research and GCI is a symbiotic one. You can’t have a deep understanding of one without the other.
The Influence of Terrain Features
When we look at a Digital Elevation Model, we see several key features:
- Slope Gradient: The most obvious factor, but GCI tells us the “tipping point” for that slope based on rock type.
- Curvature: Concave or convex slopes hold water differently.
- Spatial Heterogeneity: This refers to how much the landscape changes over a short distance. High heterogeneity usually correlates with high GCI.
Integrating GCI with Terrain Complexity
In modern landslide susceptibility indexing, we look at the interaction between the surface (terrain) and the subsurface (geology). For example, a “planar” terrain might seem safe, but if the GCI indicates high fault density underneath, that surface is essentially sitting on a cracked foundation.
By integrating these, we move from 2D maps to 3D “volumetric” risk assessments. This is the frontier of natural hazard analysis: seeing the mountain not just as a shape, but as a living, complex mechanical system.
Beyond GCI — Integrating Climate & Human Triggers
As powerful as the geological complexity index is, it doesn’t exist in a vacuum. It represents the “pre-disposition” of the land, but it still needs a “trigger.”
The Synergy of Rainfall and GCI
Rainfall is the most common trigger for landslides. However, a high-GCI area is significantly more sensitive to rainfall. In a low-complexity zone, it takes 200mm of rain to trigger a slide. In a high-complexity zone, 50mm might be enough to lubricate existing faults and cause a catastrophic failure. This synergy is a major focus of current early warning systems research.
Human Triggers and Land Use
We can’t ignore the human element. Deforestation, road construction, and mining all change the “load” on a slope. When humans cut a “toe” into a high-GCI slope to build a highway, they are essentially pulling the pin on a geological grenade.
Real-World Scenarios: Applying GCI
How do we actually use this in the field? Whether you’re a researcher in the Himalayas or a land-use planner in the Rockies, the application follows a similar workflow.
Best Datasets and Tools
To build a GCI-based model, you need high-quality inputs:
- GIS Platforms: ArcGIS or QGIS are the industry standards for layering this data.
- Remote Sensing: LiDAR (Light Detection and Ranging) is essential for seeing the “bare earth” through thick vegetation to identify hidden faults.
- High-Resolution DEMs: The finer the grid (e.g., 5m x 5m), the more accurately you can calculate terrain complexity.
Application in Mountainous Regions
In the Andes or the Alps, GCI is being used to map “corridors of instability.” Planners use these maps to decide where to place tunnels vs. bridges. By identifying high-GCI zones early, governments can save billions in reconstruction costs by simply avoiding the most “complex” areas.
Advanced Modeling & Future Directions
The future of landslide risk modeling is undoubtedly digital. We are moving toward “Digital Twins” of entire mountain ranges.
ML and Ensemble Learning
The next step is ensemble learning, where multiple machine learning algorithms work together to verify a GCI score. This reduces the bias of any single model and provides a “confidence interval” for the risk. Imagine a weather forecast, but for the ground: “There is an 80% chance of slope failure in Zone 4 based on current GCI and predicted rainfall.”
Space-Time Prediction
Currently, GCI is mostly static (geology doesn’t change fast). However, we are beginning to look at “dynamic GCI” which incorporates real-time groundwater pressure and seismic micro-tremors. This would allow for space-time prediction, giving us not just the “where,” but the “when.”
Policy & Practical Takeaways
For the non-scientists—the mayors, the urban planners, and the civil engineers—GCI provides a clear, actionable metric for risk zoning.
- Zoning Laws: High-GCI zones should be designated as non-residential or “special engineering” zones.
- Infrastructure Resilience: Engineers can use GCI to determine how deep a foundation needs to go. If the GCI is high, “floating” foundations or deep anchors are required.
- Hazard Maps: Modern hazard maps must include a GCI layer to be considered “gold standard” for insurance and safety audits.
Early Warning Systems (EWS)
By integrating GCI into early warning systems, we can reduce “alarm fatigue.” Instead of warning an entire county when it rains, we can target specific high-GCI “hotspots” that are statistically most likely to fail first.
Conclusion
The geological complexity index is not just another data point in a spreadsheet. It marks a real shift in how we understand the planet’s stability. Instead of guessing risk from the surface alone, it measures what lies beneath. It captures fault density, rock-type diversity, and tectonic structure. Together, these hidden details give landslide risk models the depth they have always needed.
Looking ahead, the future is clear. When GCI connects with AI and real-time satellite data, it becomes a powerful shield for vulnerable communities. Of course, challenges remain. Models still need better weight balancing, and many developing regions lack high-resolution data. Even so, progress is moving fast. By first understanding Earth’s complexity, we take a crucial step toward living more safely on it.
Recommended Resources for Curious Minds
- Principles of Glacier Mechanics by Roger LeB. Hooke: While focused on ice, this book offers incredible insights into how pressure and material complexity lead to mechanical failure—essential for understanding GCI.
- GIS for Environmental Management by Robert Scally: A practical guide for anyone looking to get started with GIS modeling and natural hazard analysis.
- The Control of Nature by John McPhee: A classic read that explores the human struggle against geological forces, including landslides, with a narrative flair.
- Digital Inclinometer Kits (Educational Grade): For students and hobbyists, a basic digital inclinometer can help you start your own terrain complexity research by measuring slope angles in your local area.
- Landslide Risk Assessment (3rd Edition) by Mark E. Lee — The definitive technical reference covering susceptibility modeling, hazard zoning, and risk management principles. Ideal for professionals wanting deeper methodological grounding.
The links above are affiliate links. If you choose to purchase through them, Learning Breeze may earn a small commission at no extra cost to you. We only recommend resources that genuinely add value to your scientific journey.