Geology is quietly stepping into a digital age, and GIS and Remote Sensing are driving this change. Geologists no longer rely only on a hammer, a compass, and a field notebook. Now, they can study the entire continents from their screens, monitor even the smallest ground changes, and locate mineral-rich areas without being physically present at the site. This powerful technology is reshaping how the modern geology works and continues to open new possibilities every day.
Imagine spotting a landslide risk before it ever hits, or identifying a hidden gold deposit buried deep beneath the Earth. That might seem like something out of a sci-fi movie, but it’s already possible today due to modern geospatial analysis tools. These technologies act like our digital eyes from space, helping us to observe and understand the Earth in a way that were once unimaginable. Now, we can actively monitor how tectonic plates slowly shift or how rivers reshape the land, whether at a global scale, across a region, or even within a single valley.
This guide breaks down this advanced technology in a simple and friendly way. We begin with clear definitions, show you where to get the best free data, and then move straight into two real hands-on projects using QGIS and Google Earth Engine (GEE). By the end, you’ll feel confident and ready to use these powerful tools in your own geology work.
What are GIS and Remote Sensing?
Let’s clear up the confusion right away.
Remote sensing:
Remote sensing works like capturing Earth’s surface from satellites or airplanes, but it goes far beyond normal photography. Instead of just taking pictures, satellites record this data in different wavelengths such as visible light, infrared, thermal, and radar. Each of these wavelengths uncovers the unique details about rocks, minerals, vegetation, and water.
It feels almost like using “X-ray vision” for geology. While human eyes can only see three colors, red, green, and blue, satellites can detect dozens of spectral bands. Some bands pick up moisture, others highlight iron-rich areas, and radar bands can even see through clouds and darkness to identify what lies beneath.
GIS (Geographic Information System):
GIS works like our digital mapping lab. It is a tool that lets you layer, study, and visualize spatial data in one place. You can place satellite images, elevation models, fault maps, and mineral survey layers on top of each other and interact with them. Once everything is stacked, you start running calculations, noticing patterns, and making clear, visually rich maps that reveal geological insights.
Here’s the perfect combo: Remote sensing gathers the raw data. GIS helps you understand it.
Consider it this way, imagine you’re a doctor. Remote sensing acts like an MRI machine, capturing detailed images of what’s beneath the surface. GIS becomes your diagnostic software, letting you examine those images, compare them with previous scans, and detect what’s really happening.
For geologists, this means:
- Finding mineral deposits by analyzing spectral signatures
- Mapping fault lines using digital elevation models
- Tracking landslides by comparing images over time
- Studying rock formations without visiting remote areas
The best part is that you can do all of this with free tools and open data.
Types of Remote Sensing Technology Used in Geology
Different geological questions require different “eyes”. Here are the primary types of remote sensing technology used in the geosciences.
| Type of Sensor | What it “Sees” | Common Geology Usage | Real-World Example |
|---|---|---|---|
| Optical (Multispectral) | Reflected sunlight across several discrete spectral bands (Visible, Near-Infrared, Shortwave-Infrared). | Mineral detection, vegetation health (NDVI), identifying different rock types, and regional-scale geoscience mapping. | Using Landsat data or Sentinel-2 geology data to map major lithologies in a desert region. |
| Hyperspectral | Hundreds of very narrow, continuous spectral bands. | Precise identification of specific minerals (e.g., clays, sulphides), detailed alteration mapping. | Identifying specific kaolinite and illite minerals in an area of hydrothermal alteration. |
| SAR (Synthetic Aperture Radar) | Microwave energy; measures distance, roughness, and moisture content. | Ground deformation (earthquakes, volcanoes), measuring slight changes in elevation, creating DEMs. | Measuring post-seismic displacement after a major earthquake using InSAR (Interferometric SAR data). |
| LiDAR & DEMs | Laser pulses; measures the exact time it takes for light to return to the sensor. | High-resolution elevation models, landslide inventories, detailed fault mapping, precise digital elevation model generation. | Creating a highly detailed bare-earth DEM to identify subtle ancient fault scarps hidden under forest cover. |
Understanding these differences helps you choose the right data for your project. Need to map minerals in sunny deserts? Use optical. Studying volcanic deformation in cloudy regions? SAR is your friend.
Where to Get Free Geological Data
Follow this guide to access free, high-quality geospatial data. Make sure to bookmark this section.
1. USGS EarthExplorer
URL: USGS EarthExplorer
What you’ll find:
- Landsat archive (1972–present)
- ASTER imagery and DEMs
- Historical aerial photos
- Global elevation data (SRTM)
Best for: Long-term change detection, elevation modeling, North American geology
Pro tip: Create a free account to download unlimited data. Use the search filters to narrow by cloud cover percentage.
2. Copernicus Open Access Hub
URL: https://scihub.copernicus.eu
What you’ll find:
- Sentinel-1 (SAR data)
- Sentinel-2 (optical multispectral)
- Sentinel-3 (land/ocean monitoring)
- All data is free and continuously updated
Best for: Current mineral exploration, European geology, disaster monitoring
Resolution: 10 meters for Sentinel-2 (better than Landsat!)
Pro tip: Sentinel-2 has a 5-day revisit time. You can track changes almost weekly.
3. OpenTopography
URL: https://opentopography.org
What you’ll find:
- High-resolution LiDAR data
- Global DEMs (SRTM, ASTER GDEM)
- Point cloud datasets
- Processed elevation models ready to use
Best for: Detailed terrain analysis, landslide studies, geomorphology research
Pro tip: Their web-based tools let you crop and process DEMs before downloading. Saves you time and storage space.
4. NASA Earthdata
URL: https://earthdata.nasa.gov
What you’ll find:
- MODIS data (daily global coverage)
- ASTER on-demand processing
- Soil moisture data
- Land surface temperature
Best for: Large-scale regional studies, climate-geology interactions, thermal mapping
Pro tip: Use NASA’s Worldview tool for quick visual exploration before downloading full datasets.
Quick Data Cheat-Sheet
| Data Source | Best Dataset | Resolution | Ideal Geological Use |
|---|---|---|---|
| USGS EarthExplorer | Landsat 8/9, SRTM DEM | 30m, 30m | Mineral mapping, elevation |
| Copernicus Hub | Sentinel-2 | 10m | Current rock/mineral mapping |
| OpenTopography | LiDAR, high-res DEM | 1–5m | Landslide, fault analysis |
| NASA Earthdata | ASTER, MODIS | 15–250m | Regional thermal studies |
Storage tip: Satellite images are huge (500MB–5GB per scene). Start with small areas of interest. Process first, then expand.
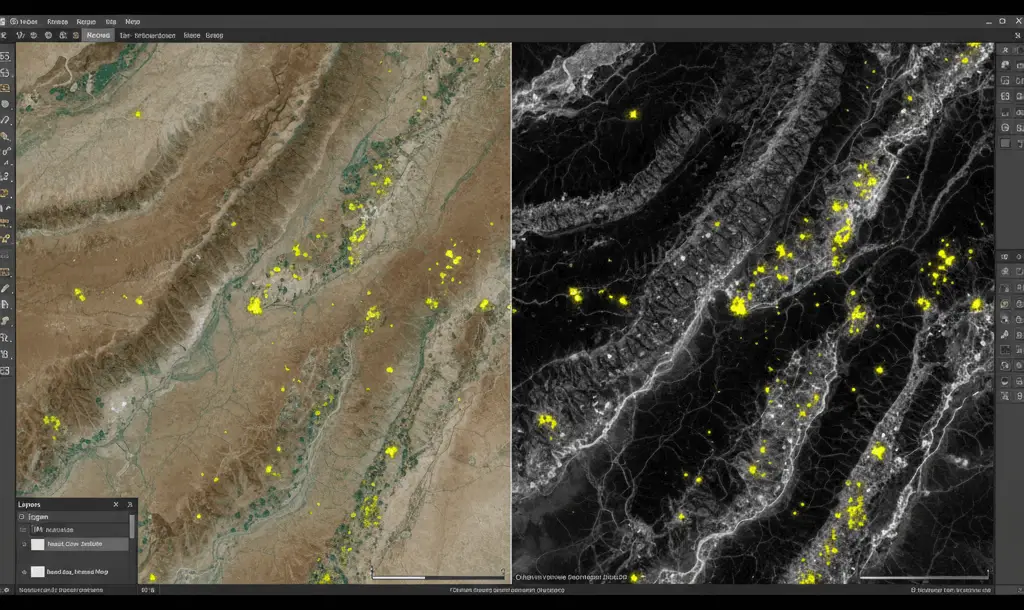
Hands-on Project 1: Detecting Mineral Zones with Sentinel-2 in QGIS
Remote sensing becomes seriously powerful when we use spectral bands to reveal materials that the human eye would normally miss. In this project, we apply the Iron Oxide Band Ratio to spot signs of surface mineralization. It’s a core GIS technique used in mineral exploration and a great starting point for understanding how remote sensing supports geological discovery.
Tools and Data Needed
- Tools: QGIS (open-source desktop GIS software).
- Dataset: A cloud-free Sentinel-2 image tile covering a known or suspected mineralized area (downloaded from Copernicus Open Hub).
Step-by-Step with Raster Calculator Formulas
We will use the band ratio technique, which divides the pixel values of one band by the values of another. This action suppresses brightness variations caused by terrain and focuses only on the unique spectral absorption or reflection properties of the target material.
- Load Data: Load the Sentinel-2 bands B4 (Red), B8 (Near-Infrared), B11 (SWIR 1), and B12 (SWIR 2) into QGIS.
- Iron Oxide Ratio (For Hematite/Goethite): Iron oxides absorb strongly in the blue/green and reflect in the red, giving a high B4/B3 ratio.
- QGIS Raster Calculator Formula:
("B4@1" / "B3@1") - Interpretation: Higher values (brighter pixels) in the output often indicate a higher concentration of iron oxides.
- QGIS Raster Calculator Formula:
- Clay Alteration Index (For Hydroxyl Minerals like Kaolinite): Clay minerals show strong absorption in the Shortwave-Infrared (SWIR).
- QGIS Raster Calculator Formula:
("B11@1" / "B12@1") - Interpretation: Higher values indicate higher concentrations of clay/hydroxyl minerals often associated with hydrothermal alteration systems, key targets in mineral exploration.
- QGIS Raster Calculator Formula:
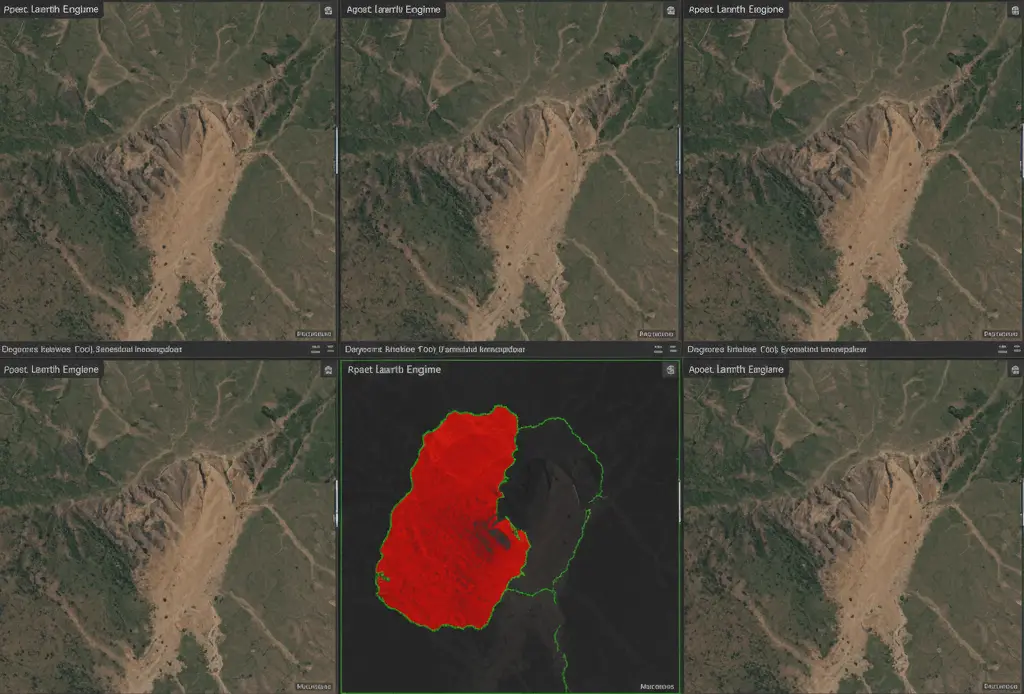
Hands-on Project 2: Landslide Change Detection with Google Earth Engine
QGIS works great for desktop-based processing, but Google Earth Engine (GEE) takes it a step further by letting you process huge amounts of satellite imagery online. It’s ideal for large-scale and time-series analysis, such as tracking changes in land over time.
In this project, we use the Normalized Difference Vegetation Index (NDVI) to spot locations where vegetation has suddenly and sharply disappeared. This sudden loss of greenery is a strong sign that a landslide may have recently occurred.
GEE Code Block (Copy-Paste Friendly)
JavaScript:
// Define the area of interest (AOI) - Replace with your geometry
var areaOfInterest = ee.Geometry.Point([-119.8, 34.4]);

// Define the dates (Pre- and Post-Landslide)
var preImage = ee.ImageCollection('COPERNICUS/S2_SR')
    .filterBounds(areaOfInterest)
    .filterDate('2023-01-01', '2023-03-01')
    .sort('CLOUDY_PIXEL_PERCENTAGE')
    .first();

var postImage = ee.ImageCollection('COPERNICUS/S2_SR')
    .filterBounds(areaOfInterest)
    .filterDate('2023-03-01', '2023-05-01')
    .sort('CLOUDY_PIXEL_PERCENTAGE')
    .first();

// 1. Calculate NDVI for both images (NIR - Red) / (NIR + Red)
var ndvi_pre = preImage.normalizedDifference(['B8', 'B4']).rename('NDVI_Pre');
var ndvi_post = postImage.normalizedDifference(['B8', 'B4']).rename('NDVI_Post');

// 2. Calculate the difference (Landslide scar shows a large drop)
var change_detection = ndvi_pre.subtract(ndvi_post).rename('NDVI_Change');

// Add the change map to the visualizer
Map.addLayer(change_detection, {min: -0.2, max: 0.8, palette: ['00FF00', 'FFFFFF', 'FF0000']}, 'Landslide Change Map');
Walk-through with Interpretation
- The code filters for the best cloud-free Sentinel-2 images before and after the likely landslide event.
- It calculates the NDVI (which tells you how green an area is) for both time points.
- The formula for NDVI is (NIR – Red) / (NIR + Red).
- The
change_detectionline subtracts the post-event NDVI from the pre-event NDVI. - Geological Meaning:
- Areas that were green (high NDVI) and suddenly lost vegetation (low NDVI) will show a high positive value in the
change_detectionlayer. - A high positive value (bright red in the visualization) strongly indicates a bare earth surface, which in a vegetated area is characteristic of a landslide scar.
- Areas that were green (high NDVI) and suddenly lost vegetation (low NDVI) will show a high positive value in the
Common Geological Indices & Band Ratios (With Ready-to-Use Expressions)
Band ratios use the simplest method of analyzing spectral bands, and they form the base for almost every advanced satellite image analysis technique. They work by using how different materials absorb or reflect light, making it easier to highlight specific features in the imagery.
| Index Name | Ready-to-Use Formula | What it Tells a Geologist |
|---|---|---|
| NDVI (Normalized Difference Vegetation Index) | (B8 – B4) / (B8 + B4) | Used as a proxy for water content and general biomass; helps differentiate barren rock from heavily vegetated areas and identify areas of active erosion/stress. |
| Iron Oxide Ratio | B4 / B3 (or B4 / B2) | Highlights areas with high iron content (hematite, goethite) on the surface, crucial for identifying weathered zones and gossans in mineral detection. |
| Clay Alteration Index (CAI) | B11 / B12 | Used to identify minerals containing hydroxyls (like kaolinite, muscovite) common in hydrothermal alteration systems (where gold, copper, etc., can be found). |
| Moisture Index (NDMI) | (B8 – B11) / (B8 + B11) | Helps map surface water content. Useful for assessing potential landslide risk and soil moisture for agricultural or engineering geology. |
For mastering spectral geology techniques, “Remote Sensing for the Earth Sciences” by Rencz offers detailed band ratio applications with case studies.
Some Case Studies (Short, Engaging Science Stories)
Theory is great. But let’s see how remote sensing geology changes lives and saves money in the real world.
1. Mineral Mapping Example
In the dry deserts of Saudi Arabia, traditional mineral exploration takes a lot of time and money. To speed things up, geologists turned to multi-temporal Landsat data and Sentinel-2 imagery. They studied small changes in the shortwave infrared (SWIR) range and used specific band ratios to highlight these variations. With this method, they were able to map large, previously unknown zones of clay alteration and iron oxide staining. This targeted geoscience mapping sharply narrowed down the areas worth exploring for copper and gold, showing how powerful and effective GIS can be in mineral exploration.
2. Earthquake/Landslide Risk Mapping Using SAR
The 2017 Central Mexico earthquake became a real-world test for InSAR (Interferometric SAR data). Scientists compared two SAR images, one taken before the quake and one after, and analyzed the phase differences, also called “fringes.” By doing this, they measured ground movement with centimeter-level accuracy. This quick satellite-based analysis helped them pinpoint the fault slip, identify how far it spread, and spot areas where the land had sharply risen or sunk. These insights immediately guided rescue efforts and informed decisions about infrastructure safety.
3. Glacier Retreat or River Migration
Tracking large-scale natural changes plays a key role in climate study and hazard prediction. For example, using GIS workflows with decades of Landsat imagery allows researchers to clearly measure how fast mountain glaciers are shrinking. In the same way, geomorphologists use accurate digital elevation models from LiDAR to study how rivers shift their course and meander over time. These insights make it easier to predict erosion and plan better management of riverbank areas.
Career & Skills Roadmap: How to Start in Geospatial Geology for Free
Want to turn this newfound knowledge into career opportunities? Here’s your step-by-step roadmap from complete beginner to job-ready geospatial geologist.
Phase 1: Foundation Building (2–3 months)
Learn QGIS Basics
- Install QGIS (free from qgis.org)
- Complete the official QGIS Training Manual
- Practice loading data, creating maps, basic spatial analysis
- Time commitment: 1–2 hours daily
Understand Basic Geology
- Review rock types, minerals, structural geology basics
- If you’re new to geology, audit free university courses on YouTube
- Focus on understanding mineral identification and geological mapping principles
- Free resource: MIT OpenCourseWare – Introduction to Geology
Master Coordinate Systems
- Understand projections, datums, and coordinate reference systems
- Practice reprojecting data (essential skill!)
- Learn when to use UTM vs. Geographic coordinates
Deliverable: Create a simple geological map of your local area using QGIS and free data.
Phase 2: Remote Sensing Fundamentals (2–3 months)
Learn Spectral Principles
- Understand electromagnetic spectrum
- Study how different materials reflect/absorb light
- Learn about atmospheric corrections
- Free course: NASA ARSET program (free webinars and training)
Practice Band Math
- Start with NDVI calculations
- Move to mineral indices (iron oxide, clay ratios)
- Experiment with false-color composites
- Practice datasets: Use Sentinel-2 data from Copernicus Hub
Understand Image Classification
- Learn supervised vs. unsupervised classification
- Practice classifying land cover and rock types
- Understand accuracy assessment techniques
Deliverable: Complete a mineral mapping project for a real location. Document your process and results.
Phase 3: Google Earth Engine (2 months)
Learn JavaScript Basics
- You don’t need to be a programmer
- Focus on loops, variables, functions (basics only)
- Free resource: Codecademy JavaScript course (first sections are free)
Start with GEE Tutorials
- Work through official Google Earth Engine guides
- Start with simple visualization tasks
- Gradually add analysis functions
- URL: developers.google.com/earth-engine
Build Time-Series Analysis Skills
- Learn to compare images across years
- Practice change detection techniques
- Understand filtering and cloud masking
Deliverable: Create a change detection project showing environmental or geological changes over time.
Phase 4: Advanced Skills (Ongoing)
Hyperspectral Analysis (Optional but Valuable)
- Learn about spectral libraries
- Practice mineral identification from hyperspectral data
- Understand spectral unmixing techniques
- Note: This is advanced—tackle after mastering basics
SAR and InSAR
- Learn radar basics and interferometry
- Practice ground deformation monitoring
- Understand coherence and phase unwrapping
- Free tools: SNAP software from ESA
Python for Geospatial
- Learn Python basics
- Master libraries: GDAL, Rasterio, GeoPandas
- Automate repetitive GIS tasks
- Free resource: Python for Geospatial Data Science (online tutorials)
Skill Validation & Portfolio Building
Create a GitHub Portfolio
- Document all your projects
- Share code, methodologies, and results
- Make it public—employers look at these
Publish on LinkedIn
- Write posts about your learning journey
- Share interesting findings from your projects
- Engage with geoscience and GIS communities
Consider Certifications (Optional):
- Esri Technical Certifications (some free courses)
- Google Earth Engine certified user (when available)
- Note: Skills matter more than certificates in this field
Your 6-Month Fast-Track Plan
| Month | Focus | Key Deliverable |
|---|---|---|
| 1 | QGIS basics + Geology review | Local geological map |
| 2 | Spectral theory + Band math | Mineral mapping project |
| 3 | Image classification + Advanced QGIS | Classification accuracy report |
| 4 | JavaScript basics + GEE intro | Simple GEE visualization |
| 5 | GEE time-series + Change detection | Landslide/change project |
| 6 | Portfolio building + Job applications | Complete GitHub portfolio |
CONCLUSION
The fusion of GIS and remote sensing in geology isn’t just a passing trend, it’s shaping the future of how we study and manage our planet. When you use free tools like QGIS and Google Earth Engine and tap into open datasets such as Sentinel-2 geology and Landsat, you can perform powerful geoscience mapping and even detect minerals, all from your own computer.
At Learning Breeze, we work to make this advanced technology simple and accessible for everyone. Now that you understand the tools and the steps, you’re ready to start your own journey into modern geological exploration.
Want to test your knowledge? Don’t forget to try our Geology Quiz and see how much you’ve learned!
Recommended Resources for Curious Minds
Ready to dive deeper? These carefully selected resources will accelerate your learning journey in GIS and remote sensing for geology.
- Remote Sensing and Image Interpretation by Lillesand, Kiefer & Chipman
- Manual of Remote Sensing by Andrew N. Rencz
- Introduction to Remote Sensing by James B. Campbell
- QGIS Map Design by Anita Graser & Gretchen N. Peterson
Quick Answers to Common Questions
GIS helps geologists collect, visualize, and analyze spatial data like rock distribution, fault lines, mineral zones, and landslide-prone areas. It turns raw datasets into meaningful geological maps that make decision-making easier and more scientific.
Remote sensing uses satellite imagery to identify spectral signatures of minerals. By applying band ratios and spectral indices, geologists can detect alteration zones and surface mineral patterns without physically visiting the area.
For beginners, Sentinel-2 and Landsat 8/9 are the best options because they are free and provide multispectral bands suitable for mapping minerals, vegetation cover, and land changes. For more advanced geological analysis, ASTER and WorldView data are widely used.
Start by learning QGIS and GEE, build 2–3 mini geo-mapping projects, and showcase them in a portfolio. Then learn advanced tools like Python geospatial libraries, SNAP, and hyperspectral analysis. Internships, certifications, and open-source contributions can accelerate your career path.
References
- Lillesand, T. M., Kiefer, R. W., & Chipman, J. W. (2015).Remote Sensing and Image Interpretation (7th ed.). Wiley.
- Rencz, A. N. (Ed.). (1999).Remote Sensing for the Earth Sciences: Manual of Remote Sensing (3rd ed., Vol. 3). Wiley.
- Campbell, J. B., & Wynne, R. H. (2011).Introduction to Remote Sensing (5th ed.). Guilford Press.
- Rashed, T., & Jürgens, C. (Eds.). (2010).Remote Sensing of Urban and Suburban Areas. Springer.
- Sabins, F. F., & Ellis, J. M. (2020).Remote Sensing: Principles, Interpretation, and Applications (4th ed.). Waveland Press.
- European Space Agency (ESA). (2023). Sentinel-2 User Handbook. ESA Standard Document.
- United States Geological Survey (USGS). (2024). Landsat 8-9 Data Users Handbook. USGS.
- NASA. (2019). ASTER User Handbook (Version 2). NASA/METI/AIST/Japan Space Systems.
- Gorelick, N., Hancher, M., Dixon, M., Ilyushchenko, S., Thau, D., & Moore, R. (2017).